In recent years, the considerable rise of social media has brought up the common misconception that email marketing is no longer as effective as it was. However, this marketing strategy keeps consistently raising the bar of both efficacy and efficiency, and these email marketing statistics are here to prove it.
Scroll down to discover analysis of up-to-date data by top-performing marketers, interpretation of figures obtained by best-selling email marketing platforms’ case studies, as well as actionable tips and hacks you can utilize to boost email marketing performance.
Email Marketing Statistics 101
- There are over 4 billion email users in the world.
- Email is a must-have brand communication channel for 86% of consumers.
- The ROI on email marketing is 4,200%.
- Email is the primary customer acquisition channel for 81% of small businesses.
- 70% of marketers claim email marketing is the best strategy in terms of ROI.
- Personalization can increase revenue per email up to 57.20%.
- 47% of recipients decide whether to open an email based on its subject line.
- The average open rate of welcome emails is 50%.
Email Usage Statistics
1. Over 300 billion emails are sent and received each day.
There is no better way to introduce the importance and state of email marketing through statistics than this. To be fair, this number includes emails for both business and private purposes. However, the figure is expected to increase to over 376.4 billion daily emails going back and forth in 2023, which clearly indicates that email use by year will continue to thrive.
2. There are over 4 billion email users worldwide.
While chat apps and social media are on a consistent rise, the growth of email usage shows no signs of slowing down either. The above email stats indicate that half of the world’s population is using email, which is more than social media and chat apps users combined. Moreover, this number is set to exceed 4.5 billion users in 2025, proving that the future of email looks bright.
3. There are nearly 5.6 billion active email accounts.
The major difference between this figure and the number of email users is obviously due to the fact that the average user has more than one email address. While the first thought that comes to mind are people’s personal and professional email addresses, emailing statistics reveal that nearly half (47%) of email users have a dedicated account that they exclusively use for emails they don’t want to open. Currently, the average email user has 1.75 email accounts, down by nearly a half from 2017 when the user to accounts ratio stood at 1:3.
4. 58% of people check their email first thing in the morning.
While this email trend is massive as it is, its greatness becomes even more evident once compared to other early-morning online habits people have. At 20%, using a search engine is the second-ranked digital activity people do first in the morning, which is nearly three times lower than the figure for email.
Surprisingly, only 14% of people check their social media first thing in the morning. On the other hand, checking the news and their company’s intranet are the least favored early-morning activities, done by only 5% and 3% of people, respectively.
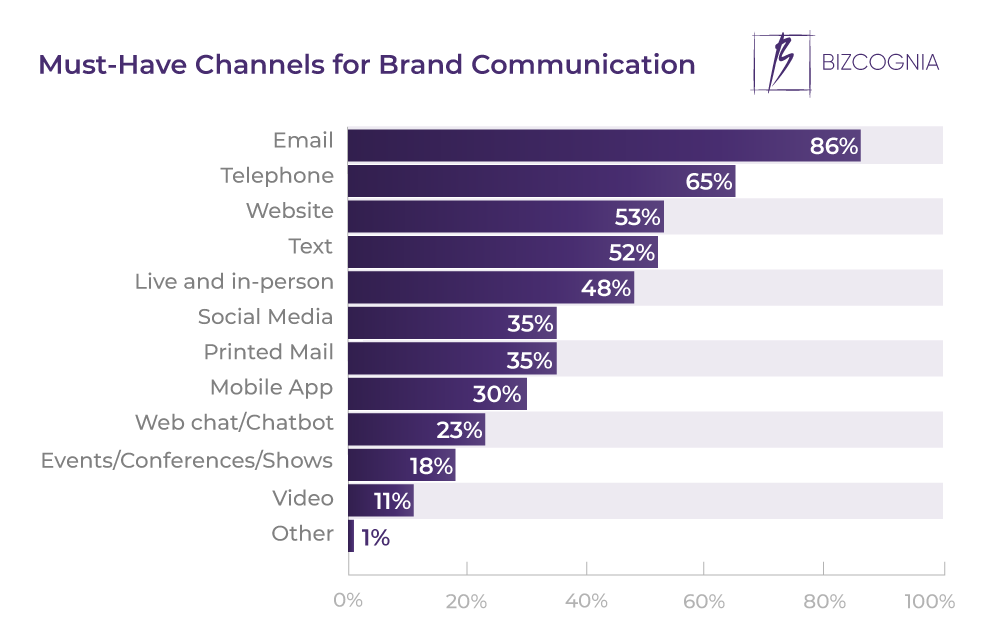
5. 86% of consumers select email as a must-have channel for brand communication.
The above is just one out of many astonishing findings revealed in an email marketing research study by CMO Council. Channels for brand communication that made it to the top five—apart from email—are telephone, website, mobile text, and in-person, in descending order of consumer preference.
When asked about the critical aspects that define their top choice of a brand communication channel, the majority of respondents, i.e., 50% of them, selected convenience. The rest of the top five attributes include reliability, speed, personalization, and trust. Being creative, interesting, or even informative were the bottom-most features consumers consider relevant when selecting the top channel for brand communication.
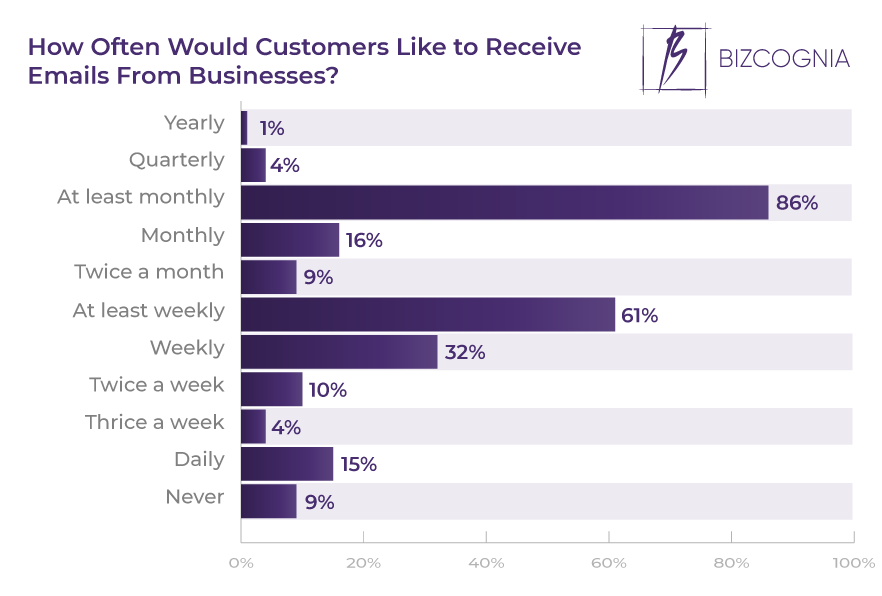
6. 86% of consumers want to receive emails from brands at least once a month.
These email marketing stats were revealed in a research by MarketingSherpa. The runner-up frequency preference is at least weekly (61%), followed by weekly (32%).
Annually takes the lead when it comes to consumers’ least preferred frequency of receiving emails, with just 1% of respondents who’d like to receive brand emails this often. This is followed by quarterly and thrice a week, with each being a preferred frequency for only 4% of the surveyed.
7. The most used email client is Gmail with a market share of nearly 34%.
At a little over 27% market share, the runner-up is iPhone’s native mail client. Followed by a massive difference in market share, Apple Mail ranks third at around 23%. The fourth and fifth places are taken by Outlook and Yahoo Mail, respectively.
Email User Demographics
8. Email usage penetration in the US stands at 90.3%.
In terms of gender demographics, at 91.1%, email usage penetration in the US is higher among female users. The figure for their male counterparts stands at 89.4%.
9. Over 93% of US internet users aged 25-44 use email.
The above figure makes this demographic the largest one among US internet users, followed by those aged 45-64 and 15-24, at 90% each. Email penetration is also high among seniors, with figures pointing to around 84% of US internet users over 65 using email.
10. At 92.1%, Asian American is the US ethnicity demographic with the highest email usage penetration.
This is followed by Other and White ethnicity groups, noting 91.8% and 91.7% email usage penetration, respectively. At 88.3%, African American users rank fourth, followed by Hispanic at 85.4%. Email usage penetration is lowest among American Indian or Alaska Natives, at 83.5%.
11. 96% of individuals in Denmark use the internet to send and receive emails.
Among other countries in the European region, Iceland ranks second with 95%, followed by Norway with 94%. With 93%, Finland ranks fourth, and the Netherlands rounds the top five with 92%.
Email Marketing Benchmarks
12. Email marketing ROI stands at $42 for every $1 spent.
One of the reasons why email is a preferred channel for marketers is its cost efficiency, clearly evident from the above figure. For comparison, the ROI of another popular means of advertising—PPC on Google—stands at $2 for every $1 spent. However, these figures shouldn’t be taken as absolutes, as the email marketing ROI statistics—or those for any other channel—greatly depend on the product/service’s cost, customer base, etc. Finally, email marketing is the channel with the highest ROI on upselling.
13. The average open rate across industries is 27.9%.
The above figure is revealed by statistics examining open rates across 20 different industries. 2019 marked the highest YOY (Year-Over-Year) growth of average open rates for emails in a period of 5 years. Moreover, the mean open rate value is up almost 33% since 2014, which is another clear indication that email marketing is not slowing down.
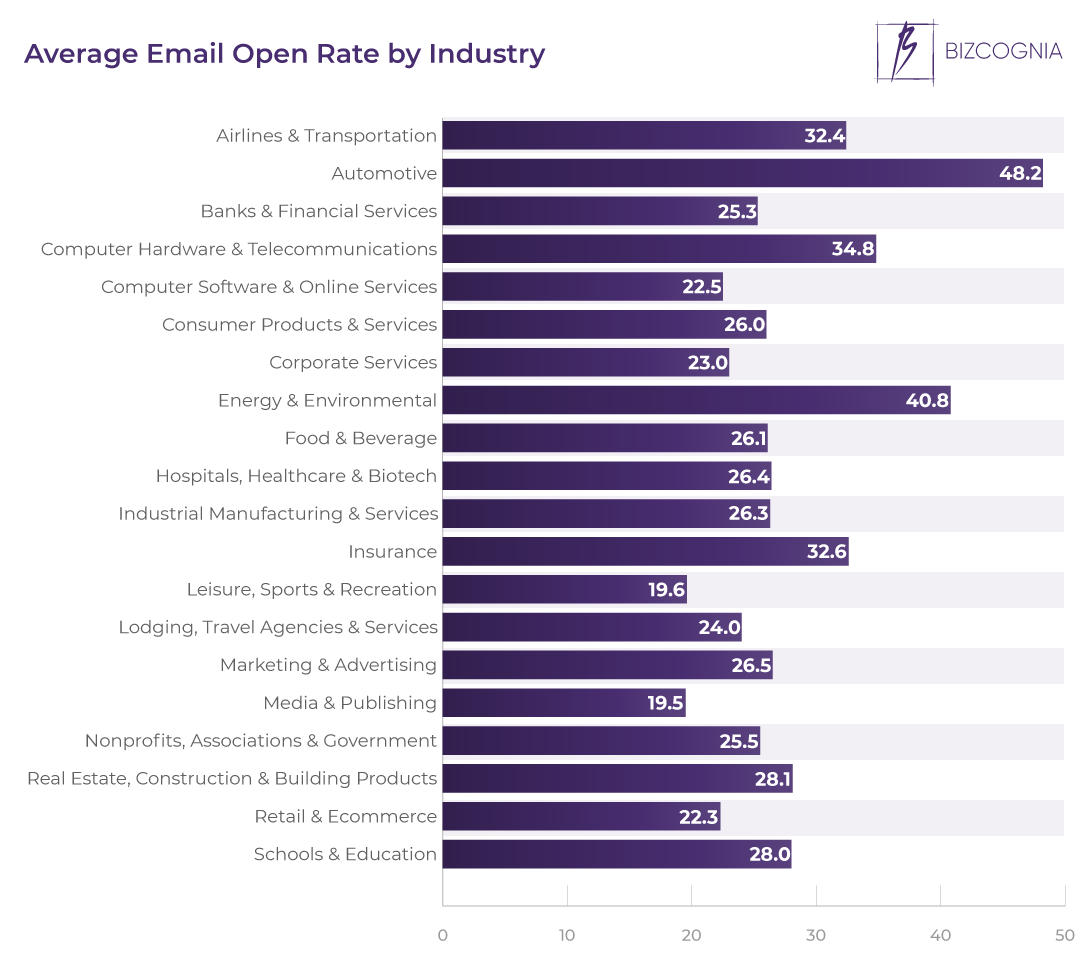
14. At 48.2%, Automotive is the industry with the highest unique open rate.
As per email marketing statistics by industry; other than Automotive—with an open rate higher than double the cross-industry average—there is only one industry (barely) exceeding the 40%-mark, and that is Energy & Environmental with an average unique open rate of 40.8%.
After another drastic difference in numbers, the third place belongs to Computer Hardware & Telecommunications, with an average open rate of 34.8%. A close cut separates Insurance (32.6%) and Airlines & Transportation (32.4%), placing them fourth and fifth, respectively.
Speaking of drastic differences in numbers; industries with the lowest open rates—and the only ones with average unique open rates below 20%—are Leisure, Sports & Recreation (19.6%), and Media & Publishing (19.5%).
15. The average open rate of transactional emails is 43.8%.
Based on transactional email stats, the mean open rate of transactional emails, i.e., order confirmations, shipping notices, etc. is almost twice as high as the one of non-transactional emails. More specifically, the average open rate of the latter stands at 23.8%.
16. The average CTR across industries is 4.48%.
The above figure is revealed by statistics examining CTR (Click Through Rate) across 20 different industries. 2019 marked the highest YOY (Year-Over-Year) growth of average CTR in a period of 5 years. Moreover, the mean CTR value is up almost 38% since 2014, making it clear that recipients are interested in interacting with emails.
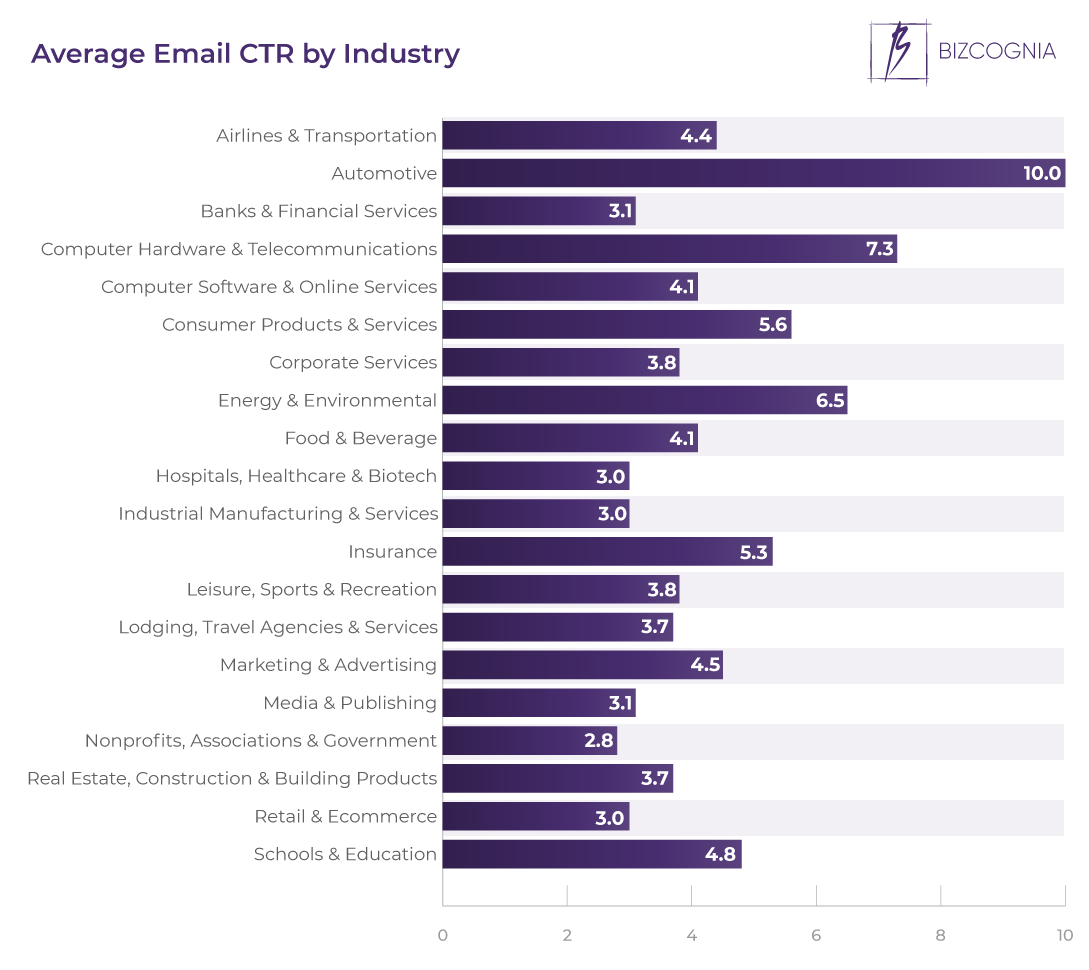
17. At 10%, Automotive is the industry with the highest average CTR.
This is no surprise if we consider email marketing benchmarks by industry, where Automotive also tops the charts of average open rate. With a wide margin between them, the second place belongs to Computer Hardware & Telecommunications with an average CTR of 7.3%.
An average CTR of 6.5% puts Energy & Environmental at number three, followed by Consumer Products & Services (5.6%) and Insurance (5.3%) at fourth and fifth place, respectively.
The category and the bottom of the list—and the only one with an average CTR below 3%—is Nonprofits, Associations & Government at 2.8%.
18. The average CTR of transactional emails is 8.7%.
As per email campaign statistics, the mean CTR of transactional emails outperforms the one of non-transactional emails by more than 50%. The average CTR of non-transactional emails stands at 3.8%.
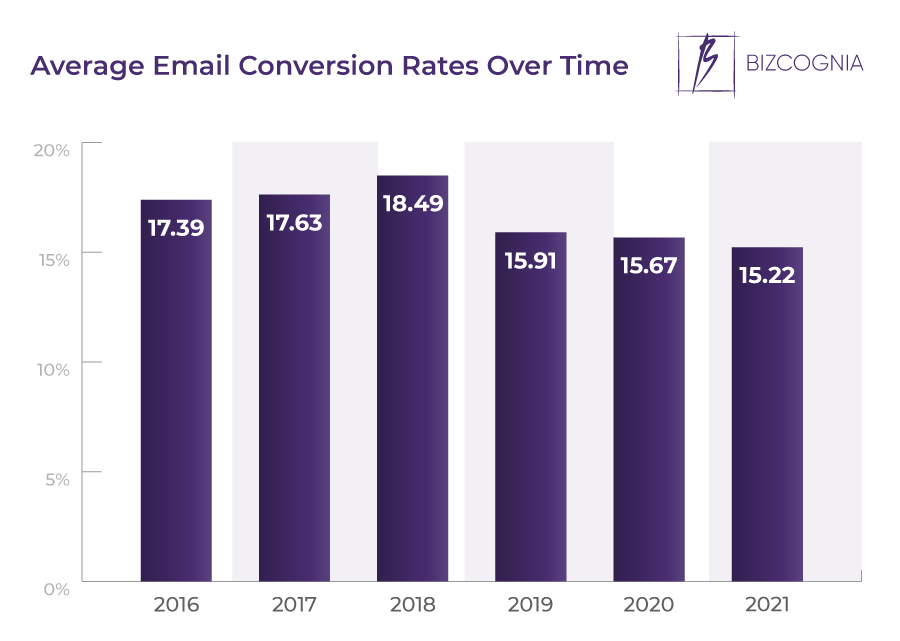
19. The average email marketing conversion rate in 2021 is 15.22%.
These numbers indicate an all-time low over a five-year period. The all-time peak was recorded in 2018, when the average conversion rate stood at 18.49%. However, the year still hasn’t come to an end, and based on last year’s numbers, email marketing conversion rates this year will certainly outperform last ones’. Finally, these mean figures should not be taken as email marketing industry benchmarks as conversion rates differ greatly based on the nature of the business, the products/services it offers, and to whom, etc.
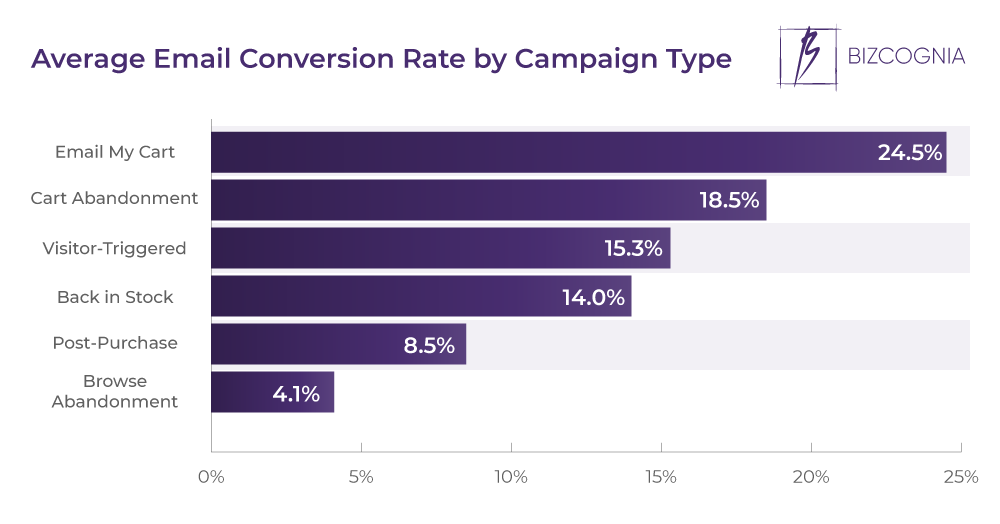
20. ‘Email My Cart’ campaigns note the highest conversion rate at 24.58%.
This type of campaign is triggered once the customers who have added items to their cart terminate the checkout session. With that in mind, the above figure is no surprise, as adding items to their cart and reaching checkout clearly indicates customers’ purchase intent.
On the other hand, ‘Browse Abandonment’ is the type of campaign with the lowest email conversion rates at 4.10%. This campaign is sent to customers who’ve browsed products on the site but failed to add them to their cart. Considering its nature and the lack of evidence for customers’ purchase intent, this campaign’s conversion rate is relatively good as well.
Pro Tip: Here is a checklist of the most prominent reasons why customers don’t reach or terminate the checkout process midway.
- Lack of product information
- Shipping and other fees listed late
- Mandatory registration/account creation
- Complicated checkout process
- Expensive and/or slow shipping
- Lack of payment options
- Uncertain security features
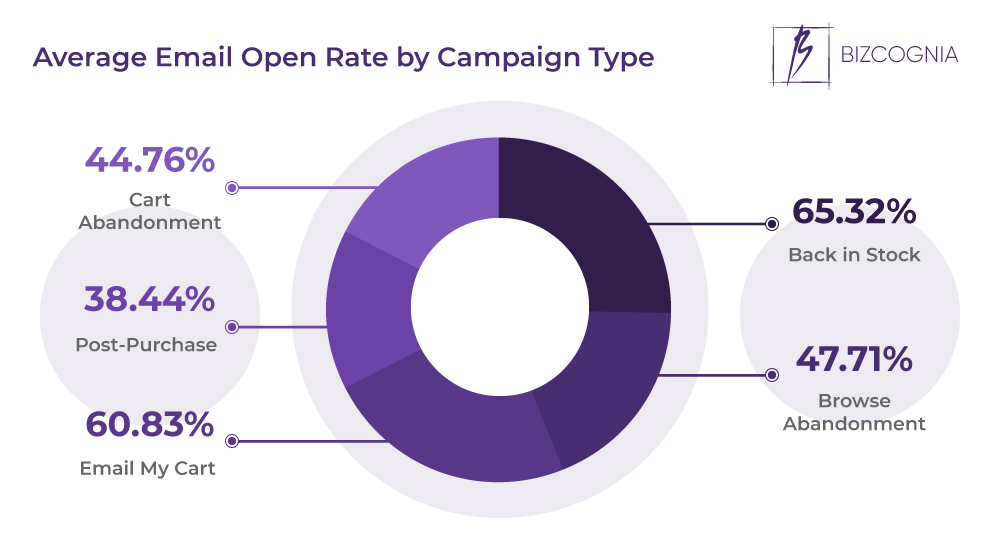
21. ‘Back in Stock’ emails have the highest open rate at 65.32%.
As the (only) reason preventing customers from completing checkout in these cases is no stock of the products they’re after, it is the undeniable purchase intent that puts ‘Back to Stock’ campaigns on top of the list with the highest average open rates.
Based on email marketing effectiveness statistics, ‘Email My Cart’ campaigns rank second in this category, with an average open rate of 60.83%. On the other hand, the campaign type with the lowest open rates is ‘Post Purchase’ at 38.44%, which makes sense as customers more or less know what to expect from these emails and often ignore them.
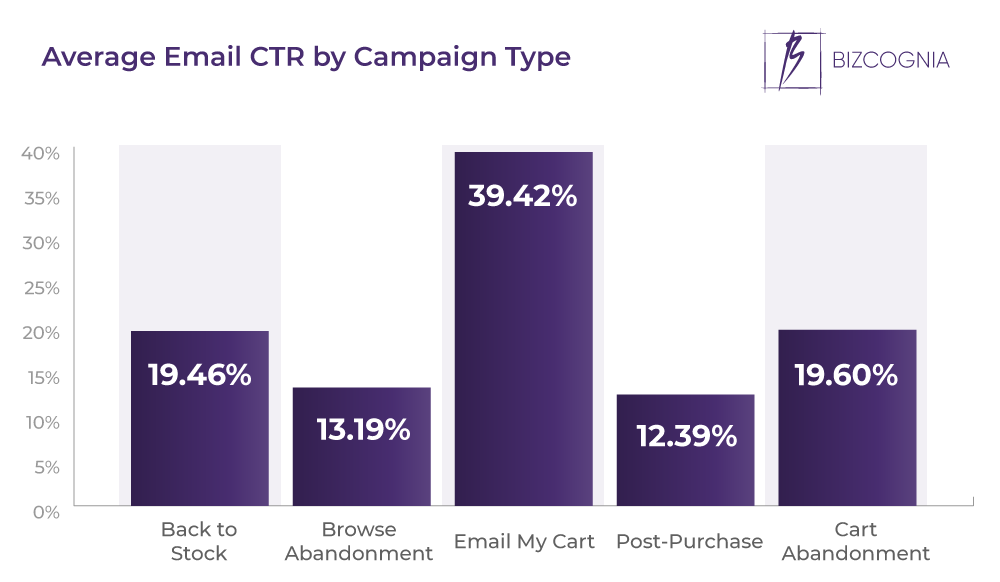
22. ‘Email My Cart’ campaigns also have the highest CTR at 39.42%.
This figure is to be expected for the highest-converting type of campaign. In fact, stats on email marketing reveal that ‘Email my Cart’ campaigns outperform ‘Cart Abandonment’ emails (19.60%)—the ones with the second-highest CTR—by over a double. ‘Post Purchase’ emails are at the bottom of this category as well, with an average CTR of 12.39%, which makes perfect sense as these campaigns are also the ones that get the lowest number of opens.
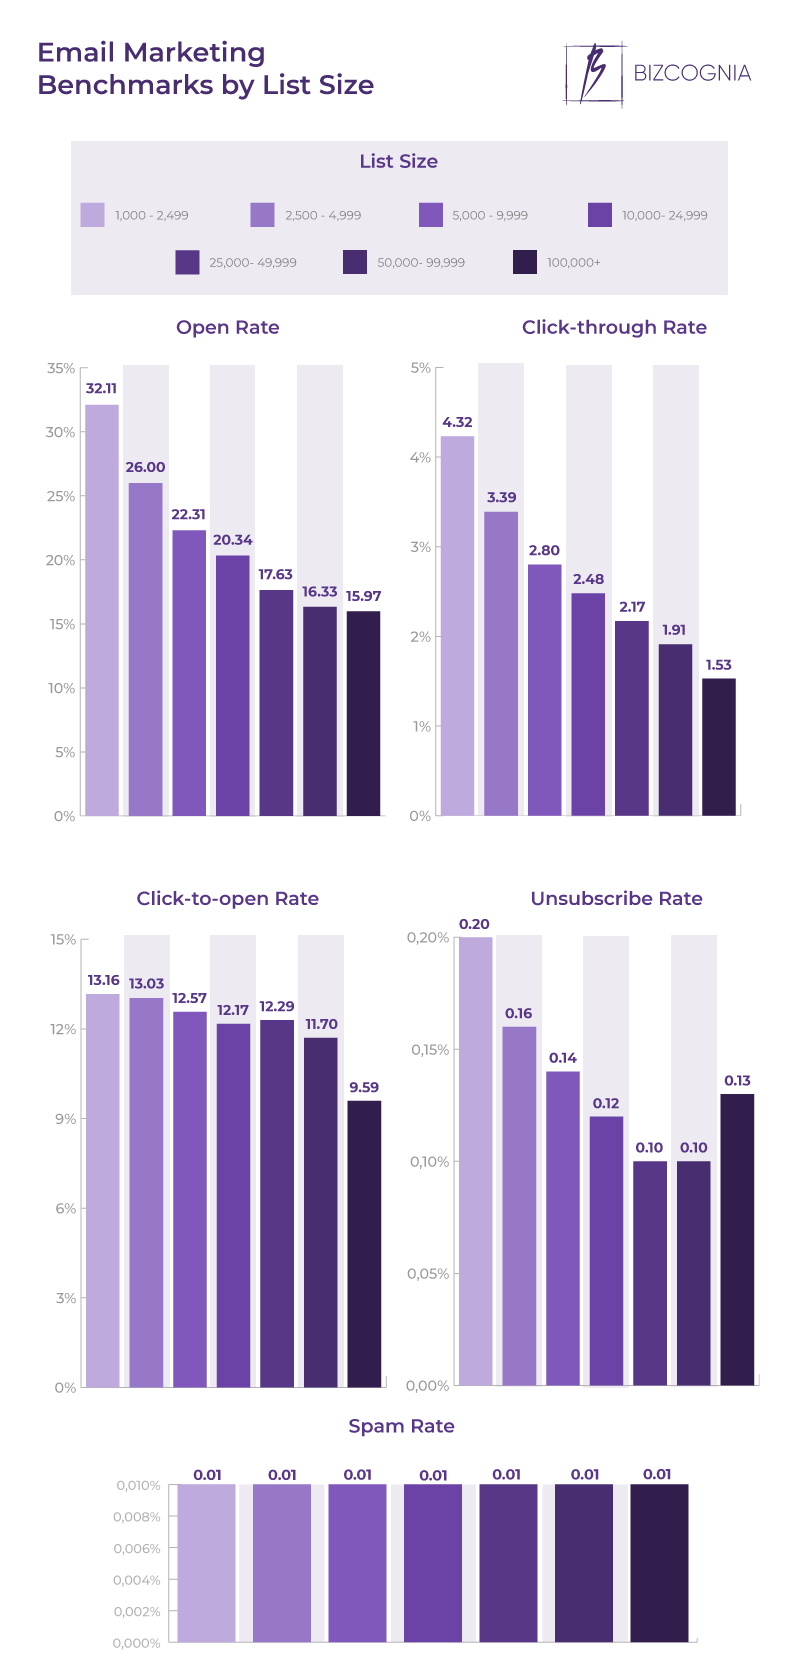
23. Email lists with 1,000-2,499 subscribers have the highest open rate at 32.11%.
Research conducted by GetResponse from July 2019 to June 2020, analyzing 5.5 billion messages out of almost 30 billion emails, suggests that the shorter the list – the better its performance. Lists with 1,000-2,499 subscribers also note the highest average CTR at 4.23%.
However, unsubscribe rate and spam rates are also highest with lists with 1,000-2,499 subscribers, standing at 0.20% and 0.01%, respectively.
24. The average email opt-in rate is 1.95%.
These opt-in email marketing statistics were revealed in a research conducted by Sumo involving over 3.2 billion site visitors. The same study suggests that only the top 10% of marketers have a mean opt-in rate of 4.77%. This figure, too, shouldn’t be taken as an absolute benchmark, as it shows the combined efforts of using landing page pop-ups and a variety of behavior-based ones, as well as opt-in bars.
B2B Email Marketing Statistics
25. 87% of B2B content marketers use email marketing to nurture their audience.
As B2B email marketing benchmarks reveal, email campaigns clearly outperform other audience nutruting methods in terms of preference by B2B content marketers. Others that made it to the top three include educational content (77%) and in-person events (61%). On the other hand, membership perks and predictive technology are the least preferred audience nurturing methods, used by 6% and 5% of B2B content marketers, respectively.
26. 81% of B2B marketers use email marketing technology to manage their content marketing efforts.
In fact, email marketing software is second on the list of the most used marketing management technologies, outranked by social media publishing and analytics tools used by 84% of B2B marketers. This emphasis on structured outreach and relationship management reflects the key principles of the B2B business model, where long sales cycles and relationship-building demand consistent, targeted messaging.
Personalized Email Marketing Statistics
27. Email personalization can increase revenue per email up to 57.20%.
The above figure was obtained in a study analyzing static one-time email sends against dynamic one-time emails with personalized product recommendations. As the case is with other statistics on email marketing, these numbers shouldn’t be taken as absolute benchmarks as their value will greatly differ based on industry, nature of the product/service, etc. For instance, other studies by digital marketing companies have revealed that personalized emails deliver 6X higher transaction rates.
28. 82% of marketers report higher open rates through email personalization.
The email personalization stats reported by these marketers most often range between 11% and 29% increase in open rate. Some brands’ case studies even report a 46% increase in open rates. As the case is with many points interpreted here, these figures cannot be taken as absolute benchmarks as each campaign is affected by multiple factors. For instance, personalizing the subject line alone is reported to increase open rates by 26%. Including the recipient’s name in it can boost open rates by 10-14% across industries.
29. 75% of marketers believe email personalization drives higher CTR.
In terms of unique click-through rates, these marketers report increases varying between 27% and 41%. Greatly differing between campaigns, CTR boost attributed to email personalization has even been reported to reach 8X for marketers utilizing personalized video in their campaigns.
While the results can vary, overall, the stats suggest that increasing personalization and shifting towards a customer-centric business model can lead to stronger engagement and potentially improve long-term email performance.
30. Only 30% of brands use personalized email campaigns.
Despite the great improvement in campaign performance reported by numerous case studies—and the fact that 96% of organizations say that personalization is key to email marketing success—a whopping 70% of marketers fail to use email personalization. Out of those who do, email personalization statistics reveal that 55% think that the industry isn’t getting email personalization right and only 30% are very or extremely satisfied with their efforts.
Email Segmentation Statistics
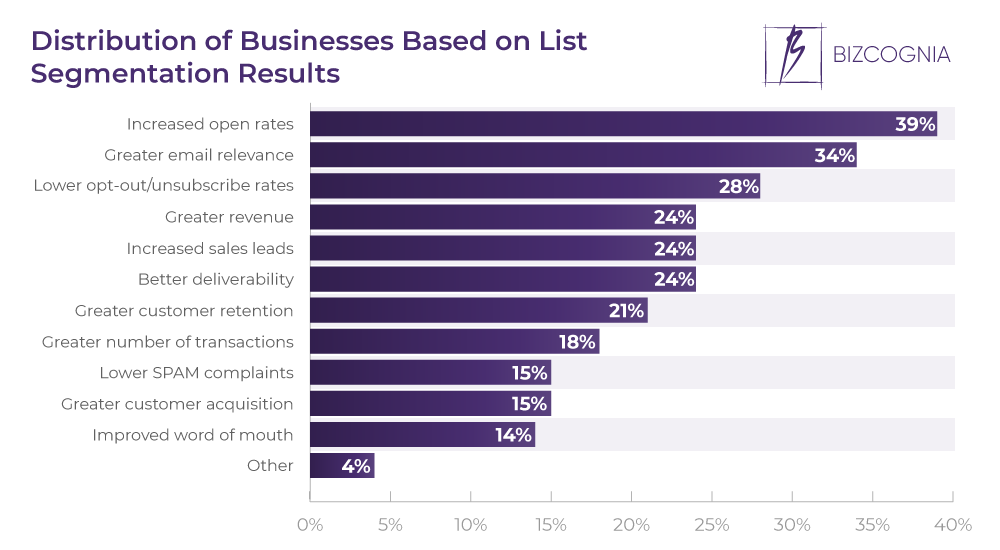
31. 89% of marketers don’t use email segmentation.
Out of those who do, 39% report increased open rates, 28% notice lower unsubscribe rates, while 21% have greater revenue. Greater customer retention and acquisition is reported by 21% and 15% of marketers, respectively. Finally, 15% of marketers also claim lower spam complaints.
32. Improving segmentation is a top initiative for only 15% of marketers.
This is yet another shocking figure on how many marketers fail to see the potential of email segmentation. To translate said potential in digits: the 11% of marketers who do segment their lists report revenue increases as high as 781% along with conversion rate boosts up to 355%, as email marketing effectiveness stats reveal.
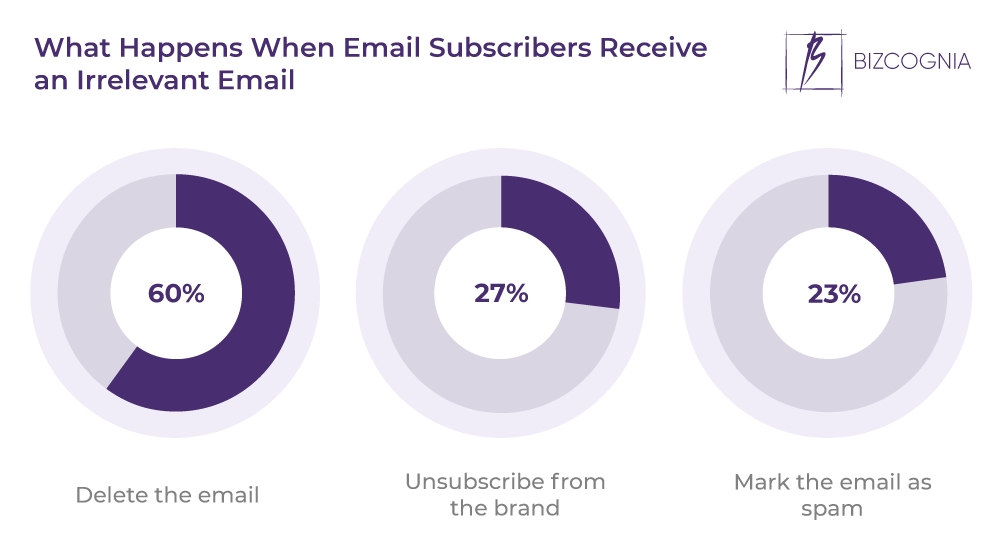
33. 60% of subscribers will delete an irrelevant email.
Failing to segment your list can lead to a 60% loss of potential conversions. What further proves the importance of email segmentation is that the lack of it can cost you over a quarter of your email list. More specifically, 27% of subscribers will unsubscribe from a brand altogether, while 23% will go as far as marking the email as spam.
Stats on Email Marketing Subject Lines
34. 47% of recipients decide whether to open an email based on its subject line.
Among other facts about email marketing that further emphasize the importance of subject lines: 69% of recipients report an email as spam based on the subject line alone. This indicates that subject line shortcomings can not only cost you an email open, but they can also compromise your email altogether.
35. Subject lines that create a sense of urgency increase open rates by 22%.
This figure was revealed upon Adestra’s analysis of over 125.000 campaigns with more than 3B emails. Some email marketing statistics even reveal certain words that trigger FOMO (Fear Of Missing Out) among recipients and, in turn, higher open rates. For instance, the word ‘alert’ boosted open rates by a whopping 61.8%, while ‘quick’ and ‘tomorrow’ increased open rates by 17% and 10%, respectively.
36. Emoji in subject lines increase open rates by 56%.
Different A/B studies also break down the influence of specific emoji over a campaign’s open rate. For instance, the umbrella emoji ☂ improves open rates by 50%, while the black sun ☀ increases them by 15%.
Emoji are not only there to capture attention and save space. Their capability to convey and trigger emotion and, in turn, an email open is evident from email marketing statistics obtained by analyzing certain emoji’s performance on specific holidays.
For example, a Valentine’s Day campaign’s open rate for emails with the kiss mark emoji 💋 in the subject line was 24%. The heart with arrow 💘 got 20%, which was the same as the open rate of emails with text-only subject lines. On St. Patrick’s, the Irish flag 🇮🇪 outperformed both text-only and subject lines with the clover emoji ☘️ by nearly 40%.
Another study was looking into the best-performing emoji in terms of open-rate increase, but unrelated to holidays. The findings reveal that the pile of poo 💩 ranked first, triggering an open rate of over 33%. The fire emoji 🔥 came second, with an open rate of around 24%; followed by the raising hands symbol 🙌, with an open rate at around 22%.
37. 82% of marketers use 60 or less characters in their subject lines.
To break this figure further; most marketers (36.5%) send emails with 21 to 40 characters in the subject line, closely followed by 34.6% of marketers that send subject lines with 41 to 60 characters. 18% send emails with subject lines over the 61 character count, while only 10% of marketers send subject lines with 20 characters or less.
Email marketing statistics on marketers’ favorite character counts do make sense if we consider that most desktop email clients won’t show characters exceeding the 60 mark, while mobile ones usually trim subject lines around the 41st character. If we consider that 46% of email opens come from mobile, it’s no surprise that working with around 41 characters is a subject sweet spot for the majority of marketers.
38. Subject lines with 7 words perform best.
See what I did there?! The above finding comes from a study of over 2 million emails analyzing subject lines’ performance based on engagement parameters like open rate and clicks. Showing similarly good email campaign stats, 6-word subject lines were the runner-up, followed by 4-word ones. Interestingly enough, adding a single word to the best-performing word count will place your subject line among the worst-performing ones, as research suggests.
39. 60% of marketers use sentence-case capitalization in their subject lines.
On the other hand, 34% of Marketers Use Title-Case Capitalization, while only 6% write their subject lines in all lowercase. An interesting point was made that all-lowercase subject lines are an underestimated email marketing trend. The line of thought being that if you were to send an email to a friend, chances are you wouldn’t capitalize it. So if marketers want to have a personal touch and friendly tone in their emails, they might want to consider not capitalizing their subject lines.
Email Marketing Content
40. 50.2% of marketers’ emails contain 300 words or less.
In a world where everyone’s inbox is cluttered; if marketers are lucky enough to get their email opened, it should be worth recipients’ 2 minutes—the average time it takes to read up to 300 words. As for the other part of the pie: 25.7% of marketing emails are 301-600 words long, 12.7% are 601-900 words long, while 11.4% exceed the 900-word-count. Finally, the average email size in terms of word count comes at 434.
41. Adding videos in emails can increase click rates by 300%.
As 82% of email subscribers say they are more likely to click on interactive as opposed to static content, just the word ‘video’ in subject lines can boost open rates by 6%. Interactive email content also increases CTOR by 73%, and the fact that 65% of people would prefer emails to contain mostly images makes it clear that we prefer visuals over text.
However, email marketing stats on interactive content preference reveal that static images are also not enough. More specifically, 69% of email subscribers prefer GIFs over static images and 65% prefer video over text.
42. A single CTA can boost clicks by 371% and sales by 1,617%.
CTA (Call To Action) should not only be clear and well-placed but there should only be one of them as email recipients are more likely to convert when they’re not confused about which action they should take. When it comes to the type of CTA, email marketing trends reveal that button-based calls-to-action outperform link-based ones by 28% in CTR.
Email Marketing Optimization
43. The average open rate of welcome emails is 50%.
Email newsletter statistics indicate that welcome emails are a whopping 86% more effective than regular newsletters in terms of open rate. This does make sense, as 74% of people who subscribe to a list expect an immediate email.
What’s more, welcome emails get 5X more clicks than regular email campaigns, generating up to 320% more revenue than other promotional emails. Despite these outstanding figures, only 57.7% of brands send welcome emails to their new subscribers.
44. 85% of consumers subscribe to an email list hoping for a reward.
On its own, this figure merely indicates the majority’s motivation for signing up for marketing emails. Utilizing it wisely would mean sending new subscribers a welcome email with a unique discount. In fact, welcome email statistics suggest that welcome emails that contain an offer have a 30% higher revenue-per-email than those that don’t.
This tactic works particularly well in ecommerce business model structures, where first-purchase incentives and time-sensitive deals help convert casual visitors into paying customers.
45. The best time to send an email is at 8 AM and 5 PM.
Along with the typical commute times, email marketing statistics reveal that 1 PM is also a good time of the day to send an email. However, these hours vary in terms of how they perform.
For instance, emails that see the highest open rates are ones sent at 8 AM, 1 PM, and 4 PM, with a peak noticed with the morning emails. On the other hand, those same times are also great in terms of CTR; however, the peak here is at 5 PM.
For optimal results, marketers should break down the day of their ideal customer and send emails at times where they can catch their attention—while being wary of their timezone!—so they can click and convert.
46. The best day to send an email is on Thursday or Tuesday.
When it comes to user behavior email marketing statistics and metrics, multiple studies indicate a tie between these two days in terms of open rate and CTR. While results of some email marketing companies suggest Wednesday as a good alternative for testing, a few suggest Monday for that purpose. However, all studies agree that the weekends are the worst days to send emails unless there is time-sensitive information in question.
47. 8.4% of email data entered in web forms is invalid.
As per opt-in email marketing statistics, databases lose 22.5% of their contacts every year. This data decay comes naturally (for example, a user will just abandon an old email address) and there’s really nothing you can do about it. However, preventing invalid data from entering your database is something you can manage (to an extent) by using email validation.
48. Sending 3 cart abandonment emails results in 69% more purchases than sending one.
Statistics on email marketing reveal that cart abandonment emails have an average open rate of 48%, so it only makes sense that a few more reminders would efficiently push recipients further down the funnel. As far as single emails are concerned, nearly half of them will get clicks, while half of the recipients who click will end up making a purchase. Finally, cart abandonment emails that convert best are ones sent within an hour of a user’s terminated session.
49. In over 70% of cases, mobile users will delete a badly formatted email in less than 3 seconds.
If these mobile email statistics weren’t shocking enough, as much as 15% of recipients will even unsubscribe. Oversized or out-of-place images, as well as too much text without breaks, is what triggers users to do these actions, along with lack of image alt text when their connection is poor and no responsive layout for multiple-column templates.
50. 42% of recipients decide whether to open an email based on the sender’s name.
Trends in email marketing suggest that the sender’s name is nearly equally influential as an email’s subject line when it comes to open rates. What’s more, 43% of recipients will mark an email as spam based on the sender’s name.
51. A two-step unsubscribe can reduce unsubscribe rates by 19%.
As per email marketing facts, an ‘Unsubscribe’ link is mandatory in each email you send. Without it, recipients will just mark your email as spam, and having them unsubscribe from your list is the lesser evil than compromising your email reputation. However, that single ‘Unsubscribe’ link can also lead up to accidental unsubscribes. Chances are recipients won’t bother to take the steps needed to re-subscribe, so a two-step unsubscribe is a perfect way to prevent that.
Is Email Marketing Dead?
TL;DR – no! Email is used by more than half of the world’s population, and it’s the marketing communication channel of choice by 86% of consumers. From marketers’ perspective, over 70% of them claim that email marketing is the best performing strategy in terms of ROI; which is no wonder as its ROI stands at 4,200%. As these email marketing statistics prove, email marketing is yet to reach its peak.
Sources: Statista, Statista, Finances Online, Adestra, OptinMonster, Critical Channels of Choice, Snovio Labs, Email Client Market Share, Statista, Statista, Statista, Statista, Email Client Market Share, Valve+Meter, State of Marketing, Barilliance, Barilliance, GetResponse, Sumo, Content Marketing Institute, Bluecore, CampaignMonitor, Instapage, Campaign Monitor, OptinMonster, Ignite Visibility, SuperOffice, FulcrumTech, SuperOffice, Hearst, Adestra, SendPulse, AWeber, Marketo Engage, MarTech Advisor, Zembula, Campaign Monitor, SuperOffice, WordStream, Campaign Monitor, Invesp, Disruptive Advertising, Sleeknote, WordStream, HubSpot, Oberlo, SaleCycle, Moosend, SaleCycle, Campaign Monitor, OptinMonster, Mailchimp, Medium, Letsignit, Lauro Media, Adestra