The latest Instagram statistics revealing number of users, demographics, stories, business, and influencer data.
Instagram Statistics – The Highlights
- Instagram has over 2.35 billion users.
- 63% of Instagram users open the app at least once a day.
- Over 1.3 billion images are shared on Instagram daily.
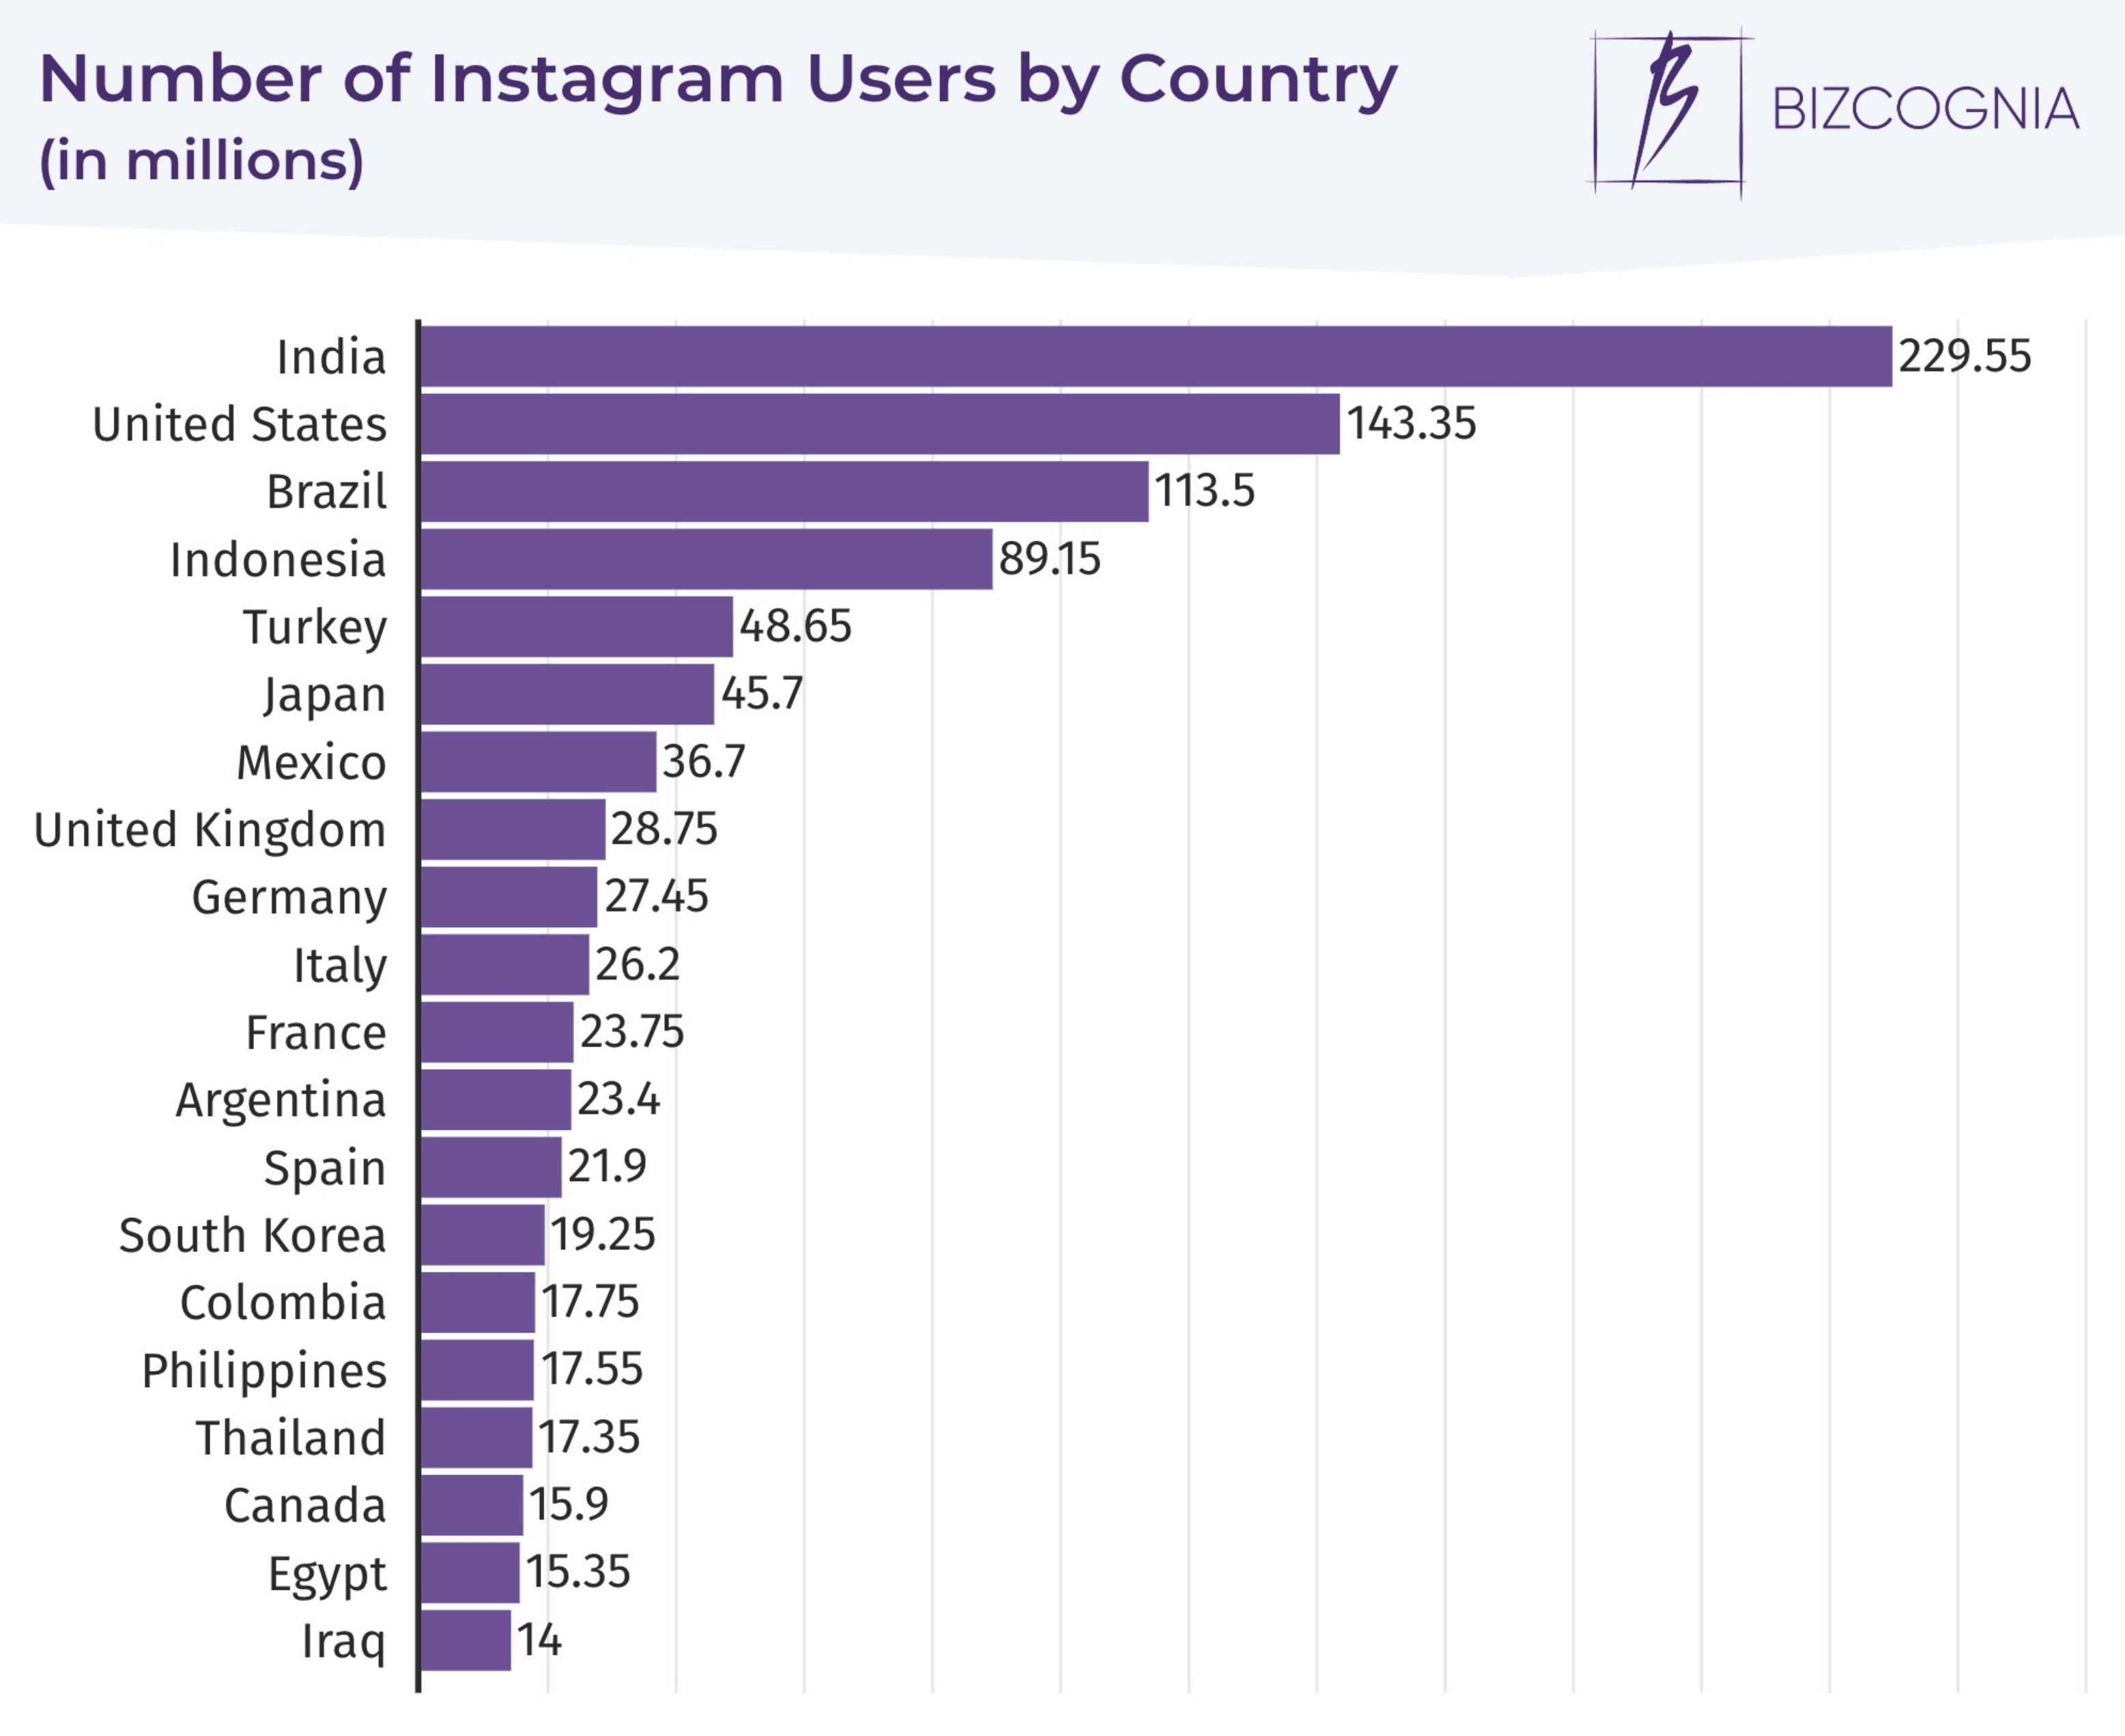
- With 229.55 million, India is the country with the most Instagram users in the world.
- 61.1% of Instagram users are 18–34 years old.
- 51.8% of Instagram users are men.
How many people use Instagram?
Instagram has over 2.35 billion users. Instagram user statistics reveal that the platform hit the 2-billion user mark in Q3 2022, and it’s expected to exceed 2.5 billion by the end of 2023.
Instagram Growth Statistics
The number of Instagram users increased by 5.47% between 2022 and 2023. To put Instagram user growth into further perspective, the platform had only 30 million users when Facebook bought it in 2012.
Instagram Usage Statistics
- 59% of Instagrammers use the app daily. 21% use it weekly, while 19% less often than weekly.
- 63% of Instagram users open the app at least once a day. 42% of users admit they check Instagram multiple times a day, 21% say they do so weekly, while only 20% log in less often than weekly.
- The average user spends around 29 minutes a day on Instagram.
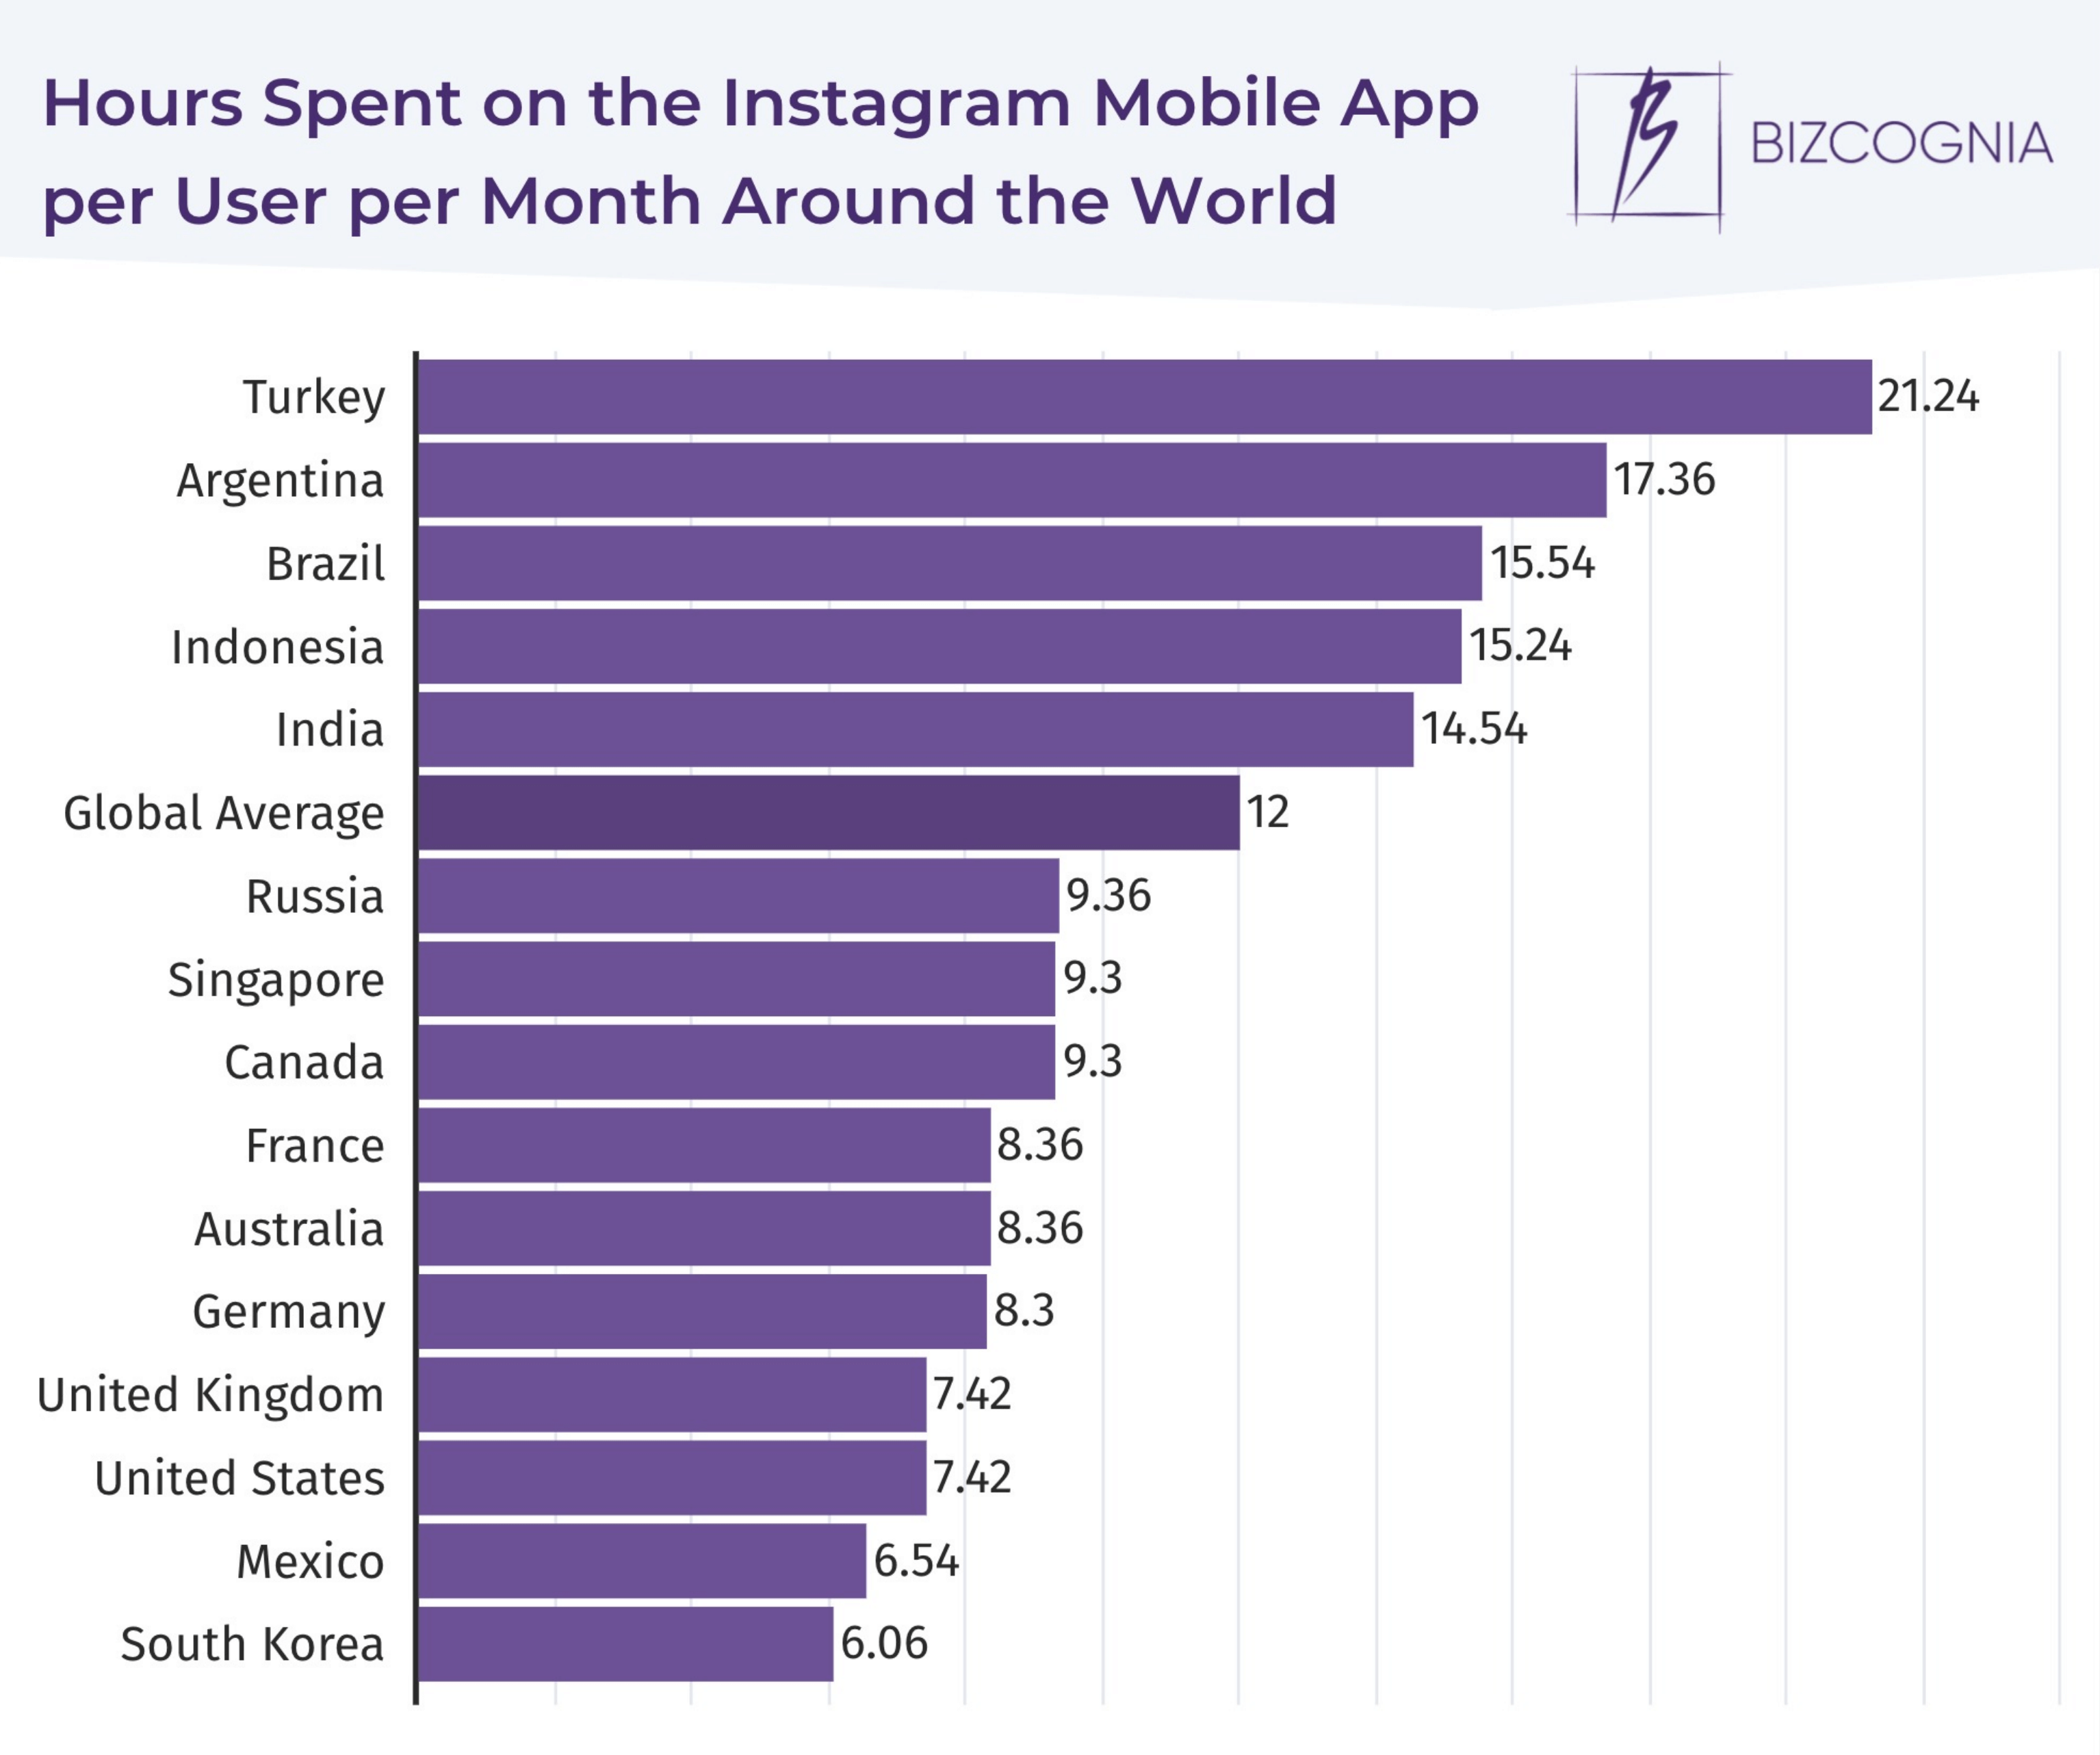
- Instagram users around the world spend an average of 12 hours per month on the app. This figure ranges from a staggering 21.24 hours among users in Turkey to a mere 6.06 hours among users in South Korea.
- Over 1.3 billion images are shared on Instagram daily. Most of them are shared on stories and in chat, while 100 million are posted on feeds.
- There are over 4.2 billion likes on Instagram per day.
- 76% of Gen Zers use Instagram.
- 13% of American adults get their news from Instagram. 29% of them do so constantly.
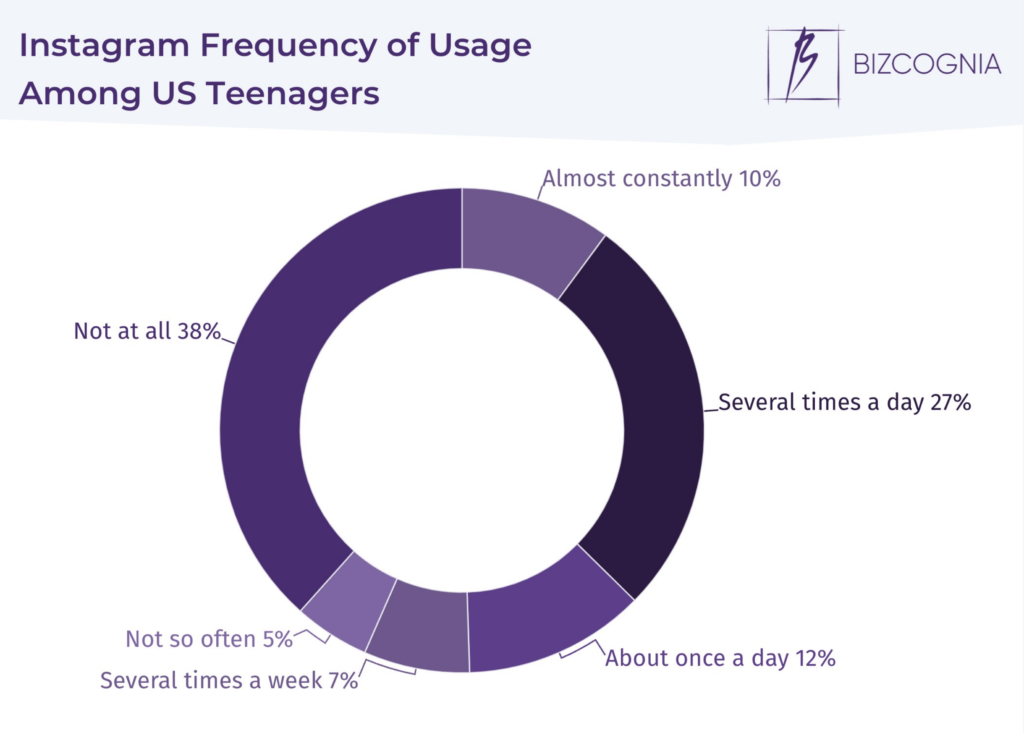
- 10% of US teenagers say they use Instagram almost constantly.
Which country uses Instagram the most?
With 229.55 million, India is the country with the most Instagram users in the world.
Countries with the most Instagram users:
- India – 229.55 million
- United States – 143.35 million
- Brazil – 113.5 million
- Indonesia – 89.15 million
- Turkey – 48.65 million
Number of Instagram users by region
| Northern America | 187.2 million |
| Central America | 57.1 million |
| Southern America | 224.5 million |
| Caribbean | 9.7 million |
| Western Europe | 85.2 million |
| Northern Europe | 53.5 million |
| Southern Europe | 76.1 million |
| Eastern Europe | 46.3 million |
| Northern Africa | 45.4 million |
| Western Africa | 17.6 million |
| Middle Africa | 2.4 million |
| Eastern Africa | 11.1 million |
| Southern Africa | 7.4 million |
| Western Asia | 127.0 million |
| Central Asia | 24.3 million |
| Southern Asia | 354.2 million |
| Southeastern Asia | 183.2 million |
| Eastern Asia | 98.8 million |
| Oceania | 16.9 million |
Instagram Demographics
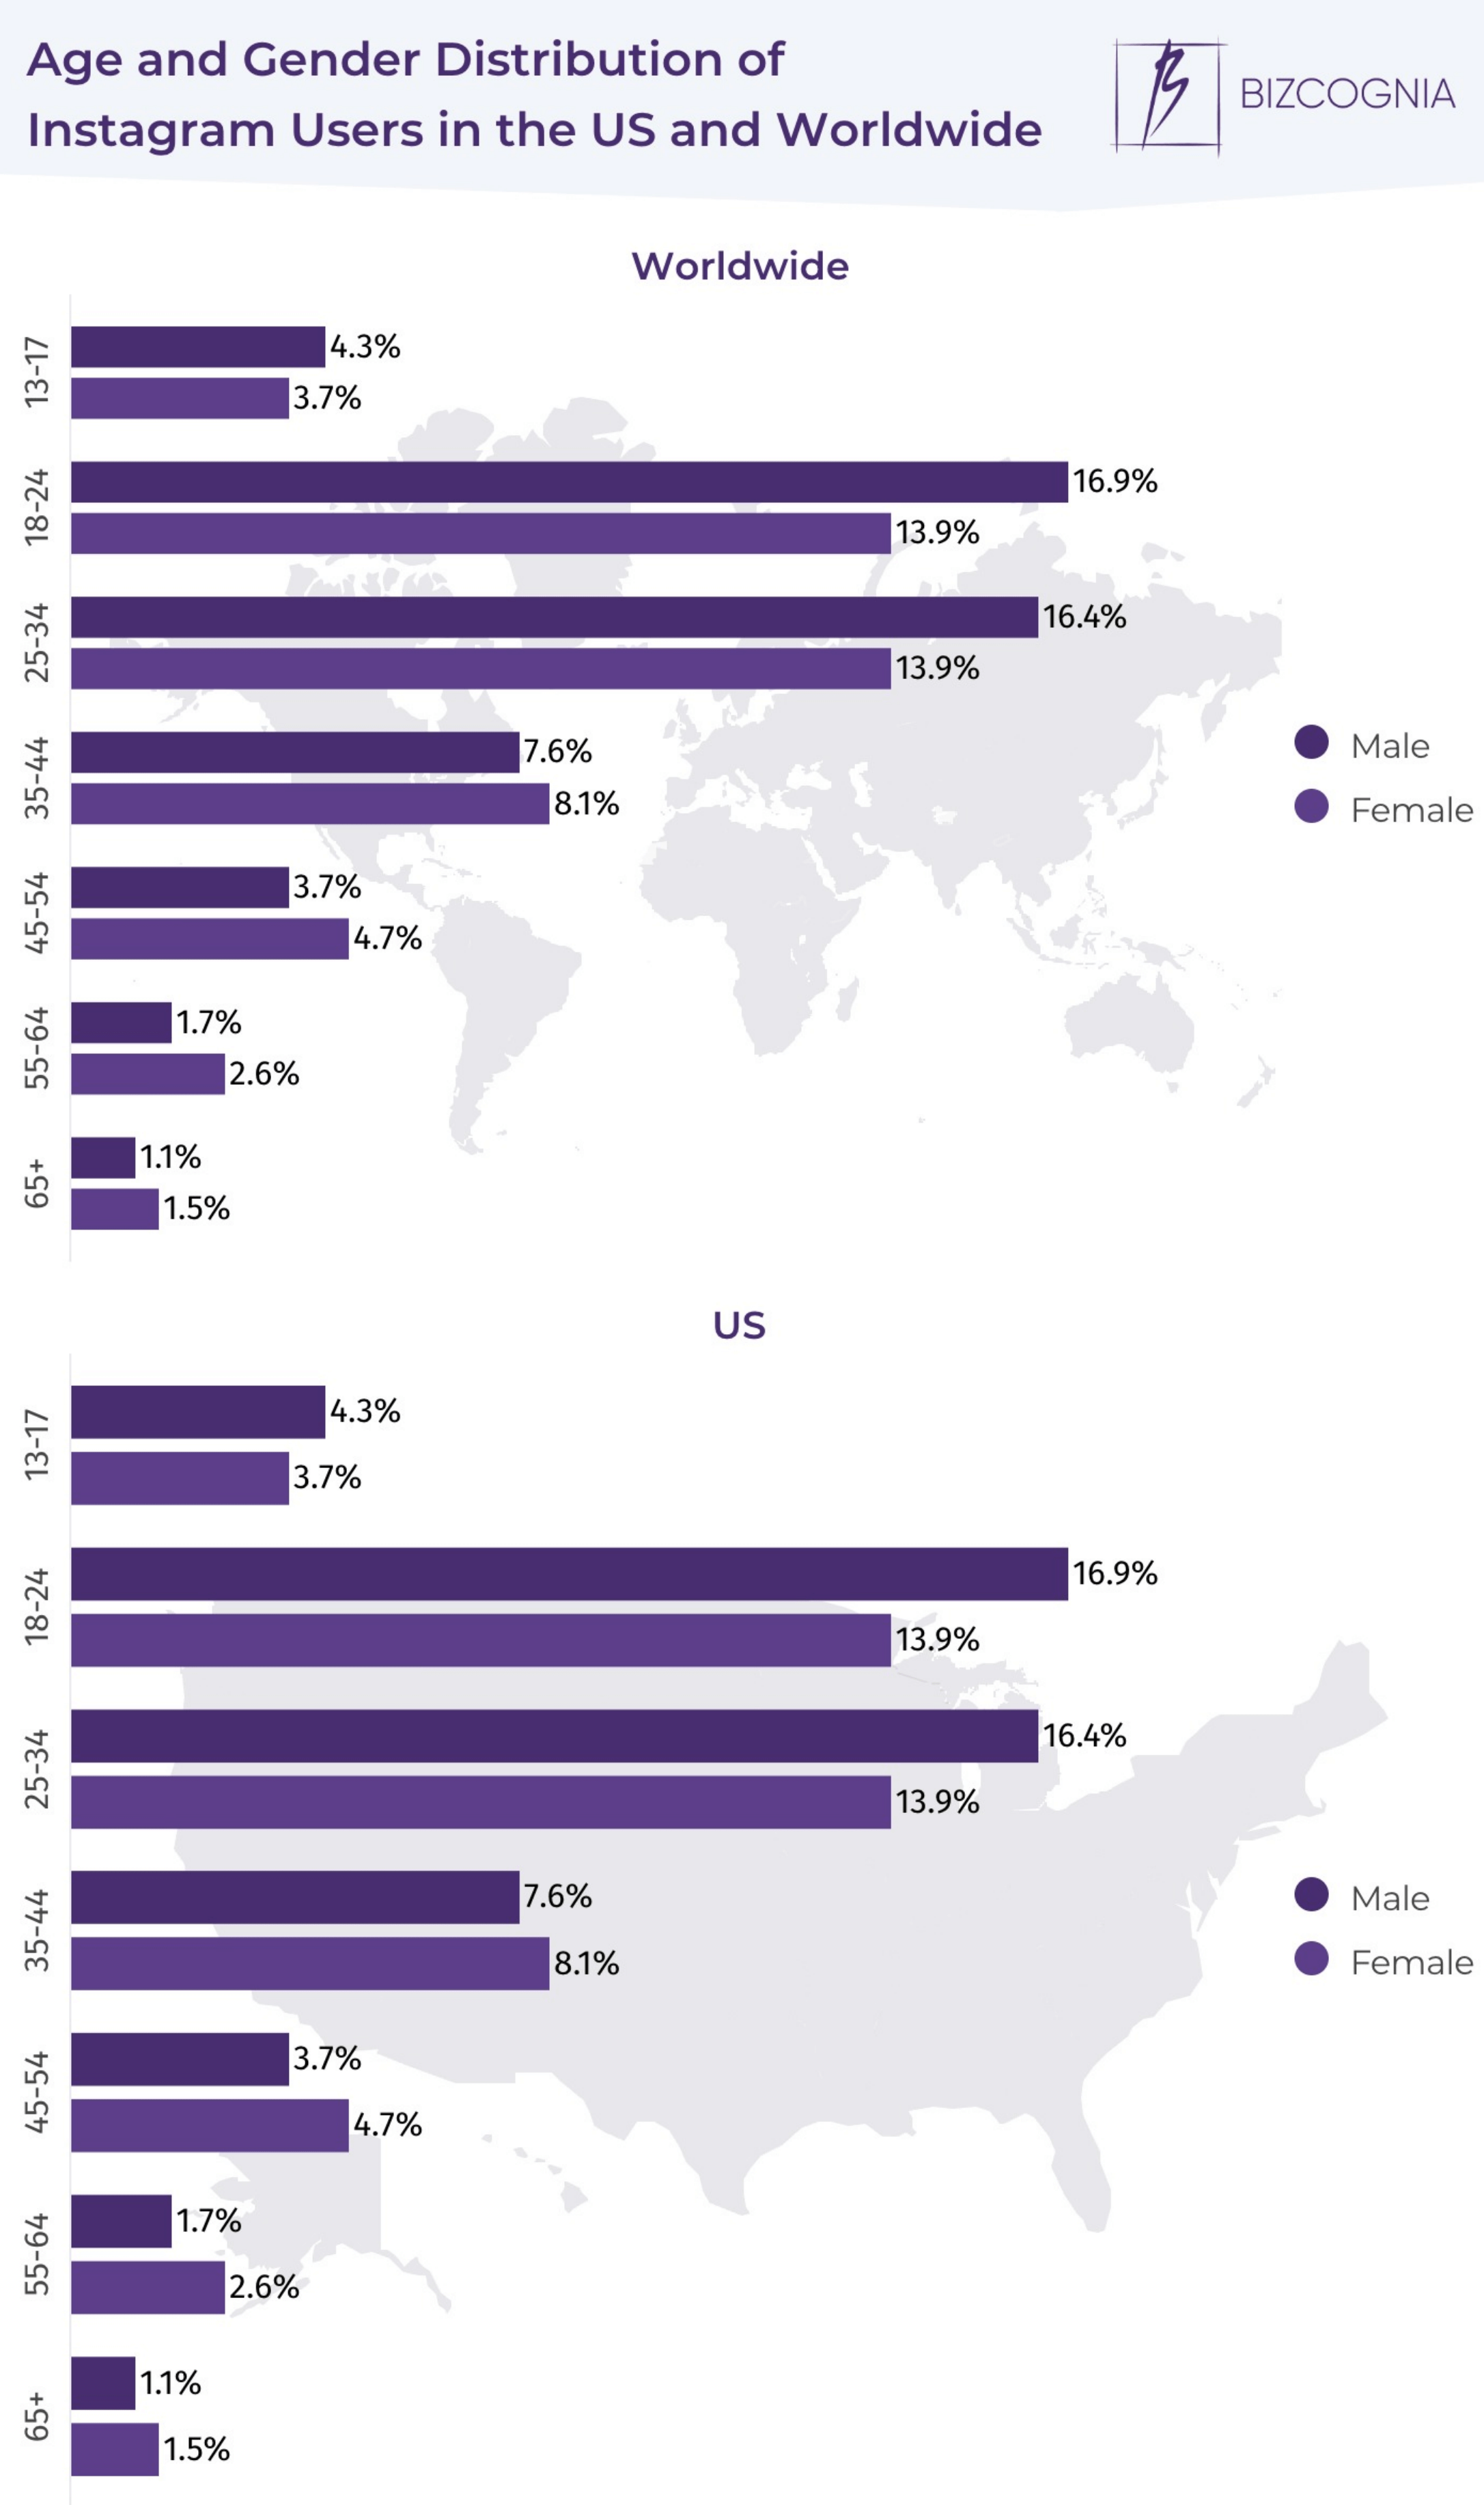
- 61.1% of Instagram users are 18–34 years old.
- 51.8% of Instagram users are men.
- 33.3% of Instagram users are 18-34-year-old men.
- 27.5% of US Instagram users are 25-34 years old.
- 56.8% of US Instagram users are women.
- 28.7% of US Instagram users are 18-24-year-old women.
US Instagram Usage Stats
- There are 143.35 million Instagram users in the US.
- 71% of US adults aged between 18 and 29 use Instagram.
- 62% of Americans between 13 and 17 years of age use Instagram.
- 60% of US internet users earning over $100k annually are on Instagram.
- 46% of urban residents in the US are on Instagram.
- 43% of US internet users who have at least a college degree are on Instagram.
- 13% of American adults get their news from Instagram. 29% of them do so constantly.
- 10% of US teenagers say they use Instagram almost constantly.
Instagram Gender Statistics
- 51.8% of Instagram users are male, and 48.2% are female.
- Women get 5X more likes on Instagram than men.
- Men are 10X more likely to like and/or comment on female users’ posts as opposed to those by other men.
- 11 out of the 20 most-followed Instagram accounts belong to women. Four belong to brands.
Instagram Stories Stats
- Over half a billion Instagram users use stories.
- 86.6% of Instagrammers post stories. Of them, only 21% plan them ahead using Instagram marketing tools.
- 70% of Gen Z-ers and 59% of Millennials watch Instagram stories.
- 39% of Gen Z-ers and 31% of Millennials create Instagram stories.
- Over 60% of Instagram stories are viewed with sound on.
- 61% of users watch Instagram stories to see what their friends are doing at the moment. 58% watch them to see authentic/unfiltered content, while around 55% do so to see funny/playful content.
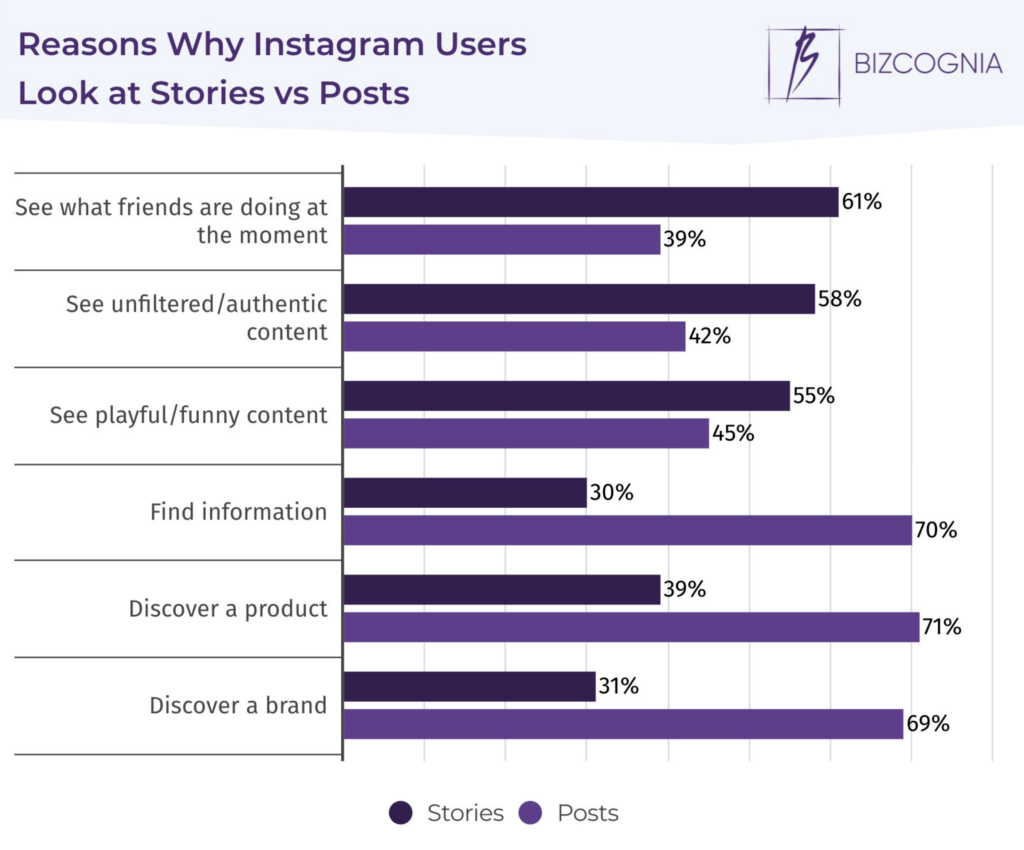
Learn more: Instagram Story vs Post
How long are Instagram stories?
Instagram stories are limited to 15 seconds in length.
How long are Instagram Reels?
Instagram Reels are limited to 60 seconds in length.
Learn more: Instagram Stories vs Reels
Instagram Reels Statistics
- Instagram Reels have a global average view time of 53 minutes per session.
- Reels have increased the time users spend on Instagram by 3.5% since their launch.
- Reels posted by Instagram accounts with up to 500 followers have a 892% reach.
- Instagram Reels get an average of 1,050 likes, 18 comments, and 239 saves.
- Reels with a combination of hashtags and captions receive two times higher engagement than those with only captions.
- Reels receive 22% more engagement than regular video posts on Instagram.
- 88.2% of influencers say Instagram reels are an essential part of their strategy.
- Reels account for 38% of content posted by brands on Instagram.
- 80% of brands plan to increase their Instagram Reels spend.
- 30% of Reels are product-focused.
- The average Reel is 16-17 seconds long.
Instagram Reels vs TikTok Statistics
- 87% of Gen Zers consider Instagram Reels and TikTok as “basically the same”.
- Brands post an average of 9.44 Reels per month, which compares to 7.67 TikToks.
- The average Instagram Reels watch rate is 13.09%, while that of TikTok is 9.06%.
- TikTok’s average engagement rate is 5.53%, while that of Reels is 4.36%.
- The comment rate on TikTok is 0.9%, while that on Reels is 0.5%.
Instagram Stories Businesses Stats
- One-third of the most-viewed Instagram stories are from businesses.
- Over 50% of Instagram business accounts post a story at least once a month.
- Businesses usually post at least two stories per week, while the number of individual frames within a story averages eight.
- One out of five stories gets a direct message response from its viewers.
- 36% of users surveyed have liked, commented, or shared a story from a brand.
- 67% of users have swiped up on the links of branded Instagram stories.
- Stories account for 34% of all sponsored content on Instagram.
- 79% of Instagram business profiles post stories. 7% publish more stories than feed posts.
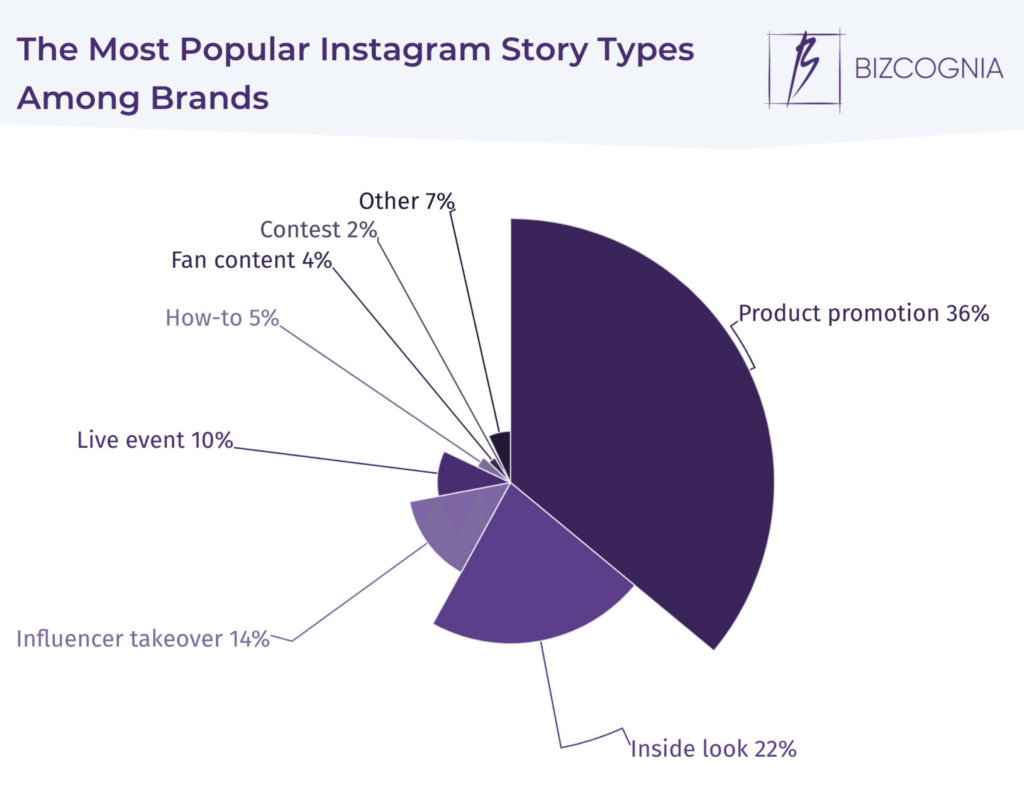
- 36% of businesses use stories for product promotion. 22% post inside looks, followed by influencer takeovers and live events, favored by 14% and 10% of brands, respectively.
- 59% of brands link their stories to shoppable pages. 23% of businesses link to other social media, while 10% link to a blog post. Brands’ least favorite options are campaign pages and apps, which are linked by 5% and 3% of business profiles, respectively.
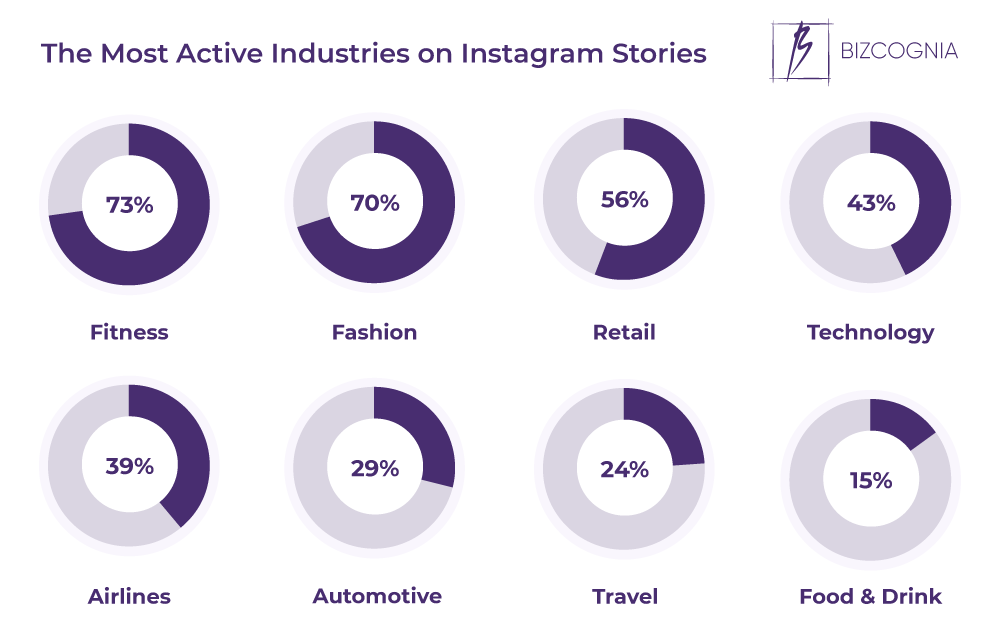
- Fitness and fashion brands use Instagram stories most frequently. Consumer lifestyle brands tend to rely on visual identity, storytelling, and consistent messaging to stay visible, and Instagram stories are the perfect format to reflect these core principles of the branding agency business model.
Instagram Business Statistics
- 90% of Instagram users follow a business on the platform. Over 200 million visit at least one business profile every day, and 60% say they discover new products on Instagram.
- 36% of Gen Zers and 19% of consumers in general start their online product searches on Instagram, making the platform an essential discovery tool for operations structured around the marketplace business model, where visibility equals value.
- 71% of Gen Zers and 40% of US consumers in general are likely to make a direct purchase on Instagram, reinforcing the platform’s role as a high-conversion channel for brands building a digital store around the ecommerce business model.
- 45% of Instagram users have made at least one purchase on the platform.
- 52% of B2B Instagram marketing agencies’ clients use Instagram, confirming that even companies operating under a B2B business model are actively leveraging visual content to reach decision-makers.
- There are over 2 million monthly advertisers on Instagram.
- 48% of small business owners use Instagram.
- 56% of Millennial business owners use Instagram, as opposed to the 40% of Gen X-ers and Baby Boomers.
Instagram Influencer Marketing Stats
- There are over half a million active influencers on Instagram.
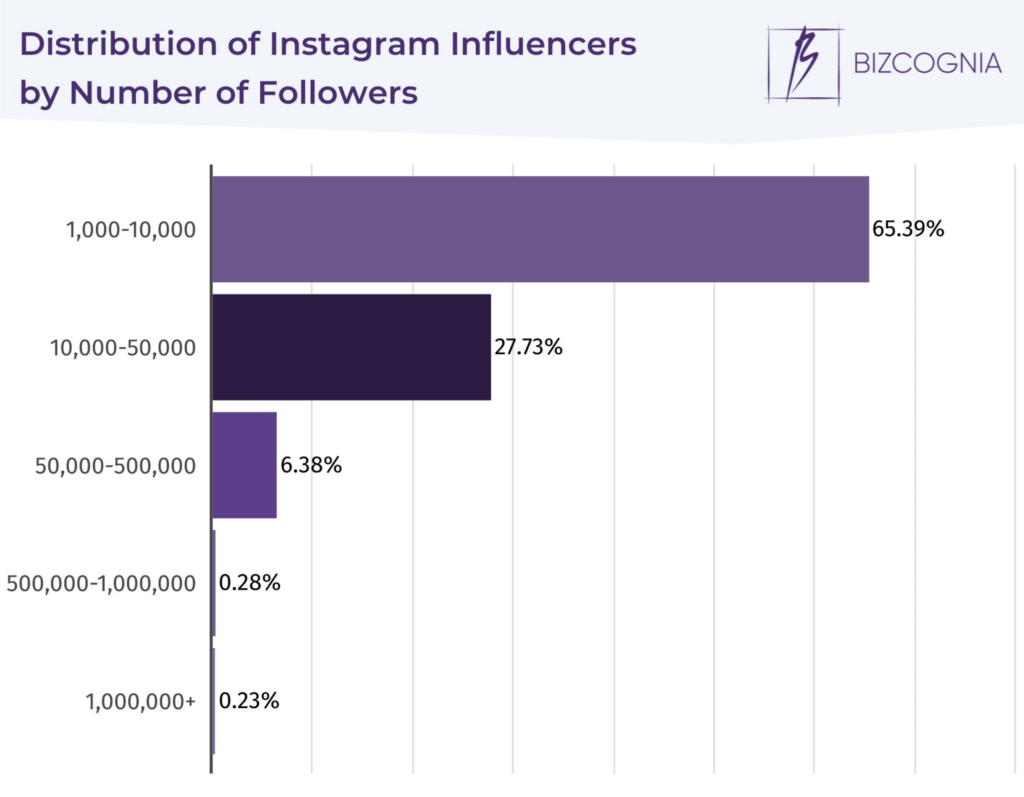
- 65.39% of Instagram influencers have 1,000-10,000 followers.
- Instagram is flagged as the most important social media for influencer marketing for 89% of marketers.
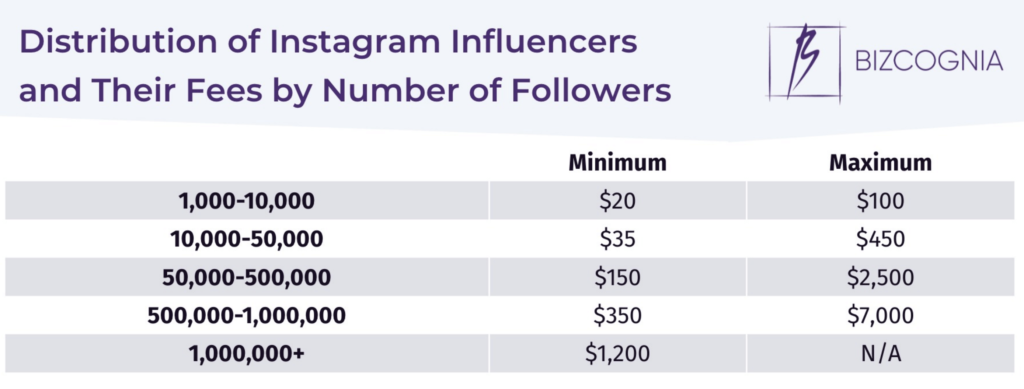
- Instagram influencers with 1,000-10,000 followers usually charge $20-$100 per post.
- 84.2% of Instagram influencers are asked to create Instagram posts for brands. This scale of influencer use can be explained by how modern brand promotion works. Many businesses rely on outside teams that follow a PR agency business model to manage their image, and influencers are key in these strategies.
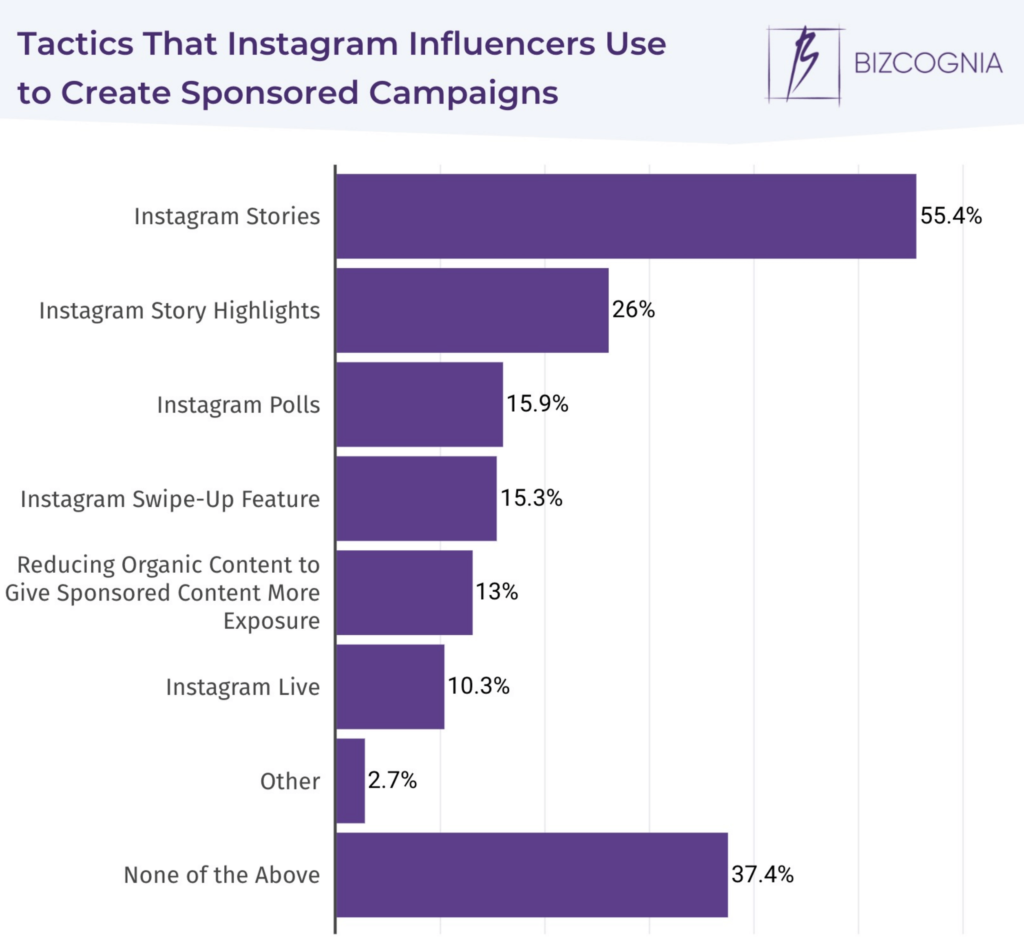
- 55.4% of Instagram influencers worldwide use stories for their sponsored campaigns.
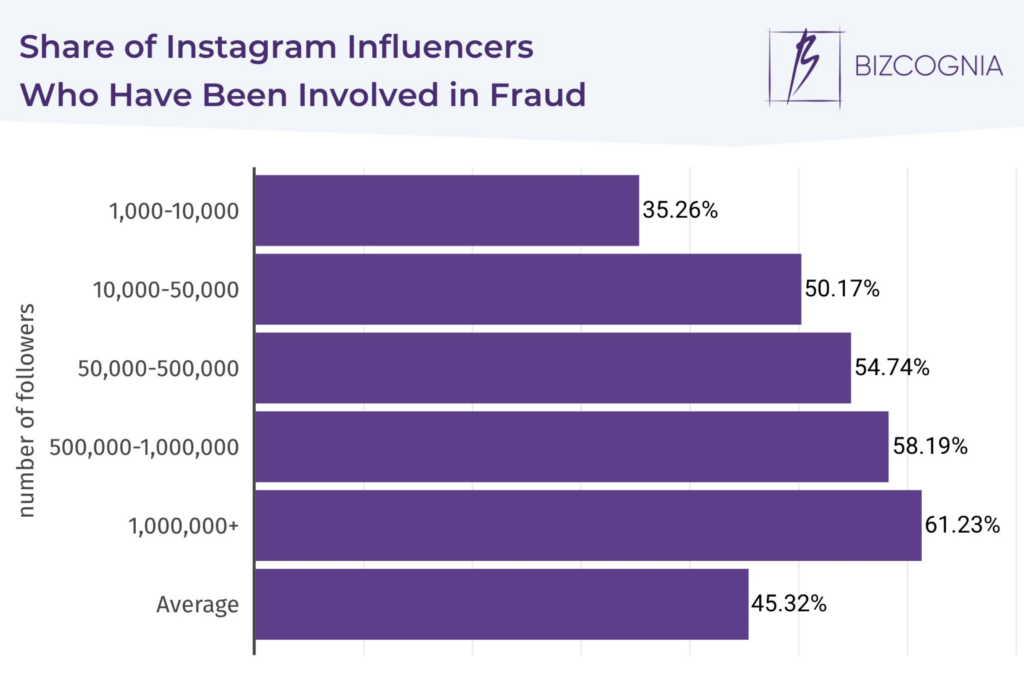
- 45.32% of Instagram influencers have been involved in fraudulent activities to inflate their engagement rates and follower counts.
- 61.23% of Instagram influencers with over one million followers have been involved in fraud.
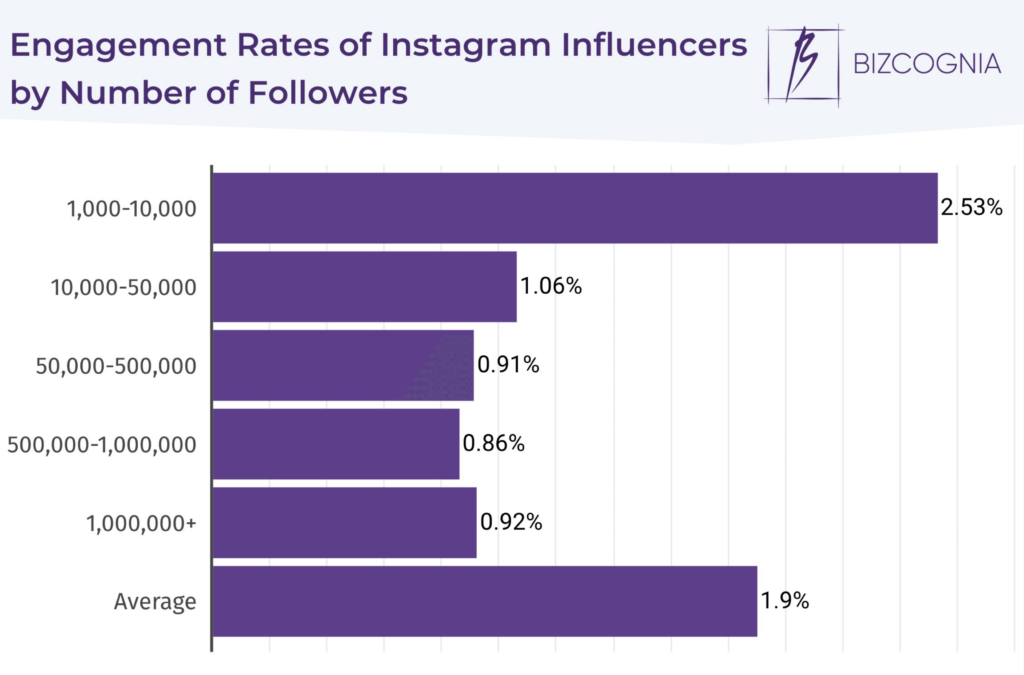
- The average engagement rate of Instagram influencers is 1.9%.
- At 2.53%, engagement rate is highest among Instagram influencers with 1,000-10,000 followers.
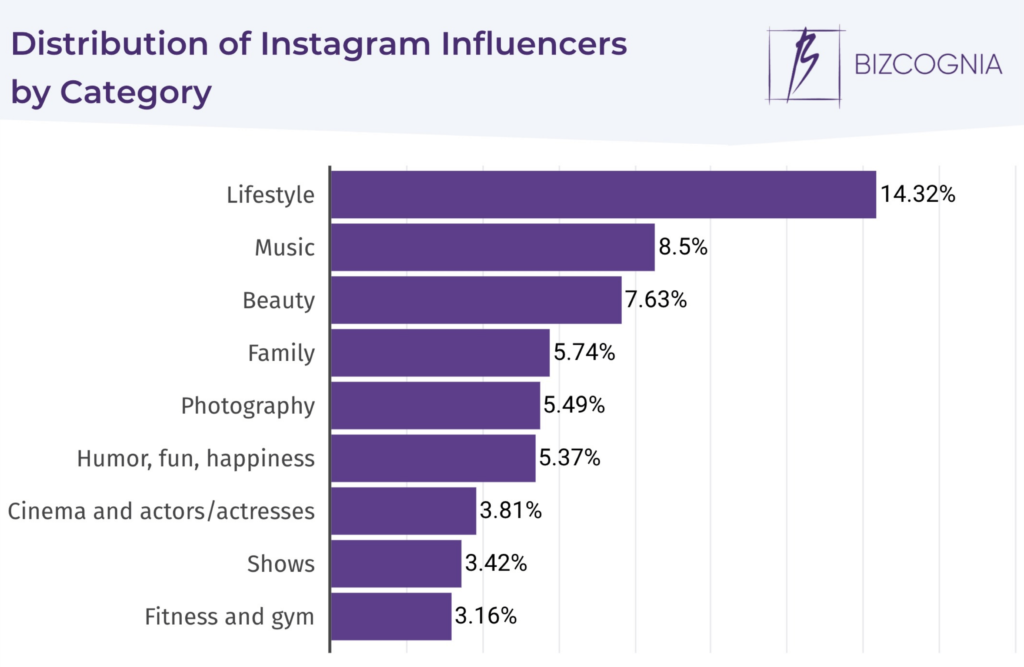
- Most (14.32%) Instagram influencers are in the lifestyle category.
When is the best time to post on Instagram?
The best time to post on Instagram is at 8 PM, when engagement rates can reach up to 7.33%.
Instagram Marketing Statistics & Benchmarks
- 80% of marketers use Instagram as part of their overall strategy.
- 85% of B2C and 74% of B2B marketers use Instagram, which reflects how essential the platform has become, especially for businesses using a B2C business model, where product discovery and visual branding heavily influence purchase decisions.
- 66% of marketers plan to increase Instagram usage in their campaigns. This growth is largely driven by the demand for fast, visual content, often developed by marketing specialists who rely on the creative agency business model to capture attention quickly and match the pace of social platforms.
- The average Instagram engagement rate is 6.01%.
- Instagram posts posted at 8 PM have the highest engagement rate of 7.33%. Those posted at 8 AM have the lowest of 5.53%.
- The average cross-industry reach of Instagram stories is 7.2%. Instagram posts, on the other hand, see a 3X bigger reach than stories.
- The average cross-industry completion rate of Instagram stories is 75%.
- At an average of 312, image posts receive the highest number of comments. This is immediately followed by video posts which receive 303 comments on average. With an average of 240 comments, users tend to leave the least comments on carousel posts.
- The best times to post Instagram stories are 4-6 AM and 8-10 PM.
- Video posts see an average of over 30 comments and nearly 2,000 likes.
- Instagram shoppable posts can increase traffic by 1,416%.
- 56.5% of all Instagram accounts use emoji.
- Posts with emoji can see up to 47.7% more interactions than ones without emoji.
- 52.3% of business accounts don’t use emoji. Out of those who do, 38.2% use 1-3, 8.7% use 4-10, and 0.9% use over 10 emoji.
- Posts with captions between 1,001-2,000 characters see the highest engagement.
- Around 34.4% of Instagram posts have no tagged users.
- Posts with a tagged location have 79% higher engagement than posts without one.
- The most tagged city on Instagram is Los Angeles.
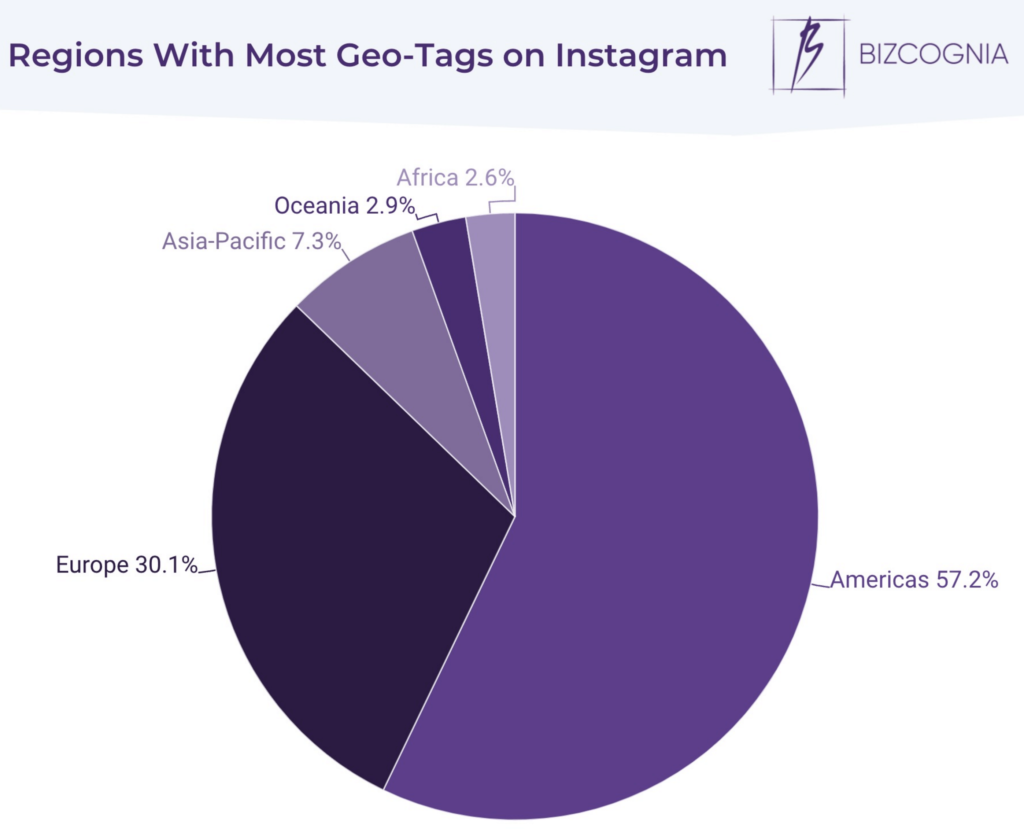
- The Americas is the most tagged region on Instagram, with 57.2% of geo-tags.
Instagram Ads Statistics
- The average Instagram CPC is $3.56, while the platform’s average CPM is $6.70.
- Instagram made $42.18 billion in ad revenue in 2022. This figure is estimated to be $50.58 billion in 2023, and $59.61 billion in 2024.
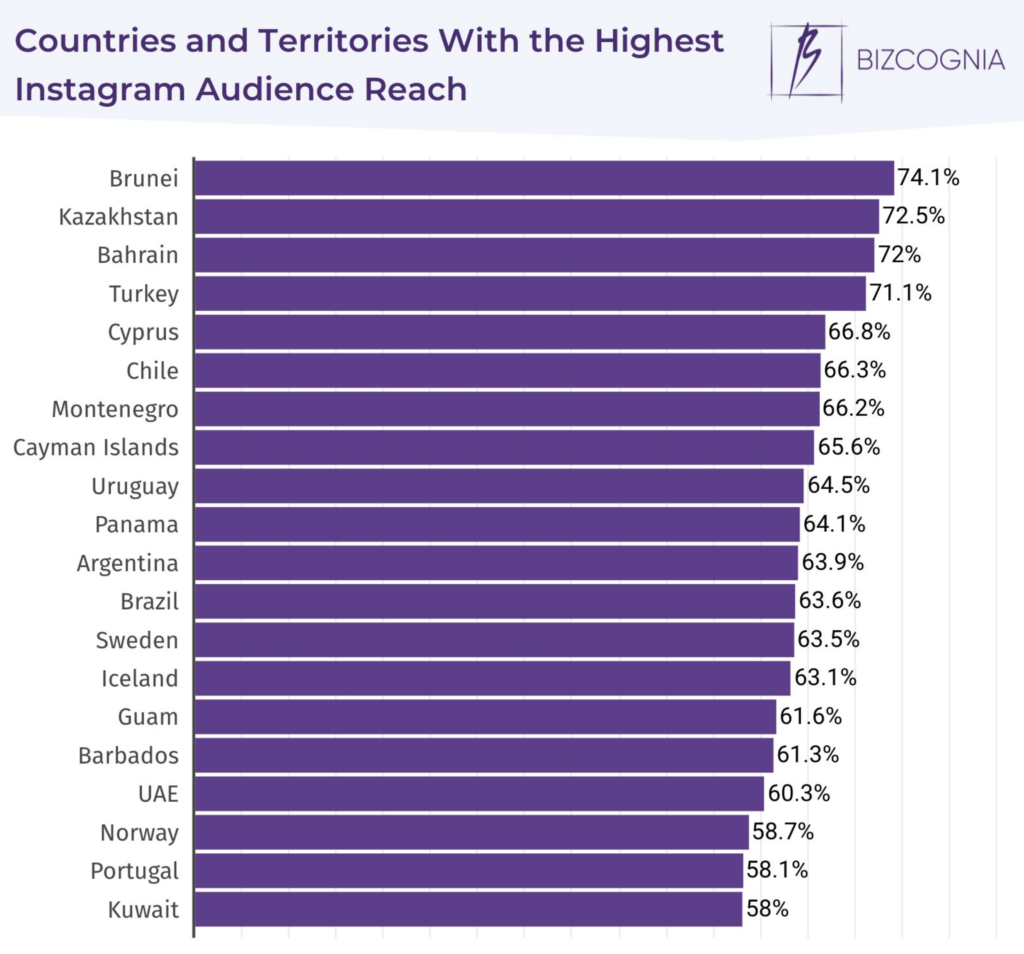
- At 74.1%, Brunei is the country with the highest Instagram audience reach.
Instagram Hashtag Stats
- Used in more than 2.1 billion posts, #love is the most popular Instagram hashtag. With 1.6 billion posts, #instagood ranks second, while fashion is third with 1.1 billion, followed by #photooftheday, #photography, and #art with 1 billion each.
- Posts with at least one hashtag get 12.6% more engagement.
- 87.7% of brands place hashtags in posts’ captions.
- There are over 114,000 banned Instagram hashtags.
Instagram Video Stats
- Instagram video posts receive around 38% more engagement than image posts.
- Story stickers increase video viewership in 83% of cases.
- Sponsored Instagram videos get 3X more comments than photos.
- 5 million videos were posted within 24 hours of Instagram announcing the video feature.
Who has the most followers on Instagram?
Christiano Ronaldo is the most followed person on Instagram, with over 270 million followers. He is only topped by the platform’s own account.
Instagram Follower Statistics
- Instagram’s own account has over 388 million followers.
- 36% of the 50 most followed accounts on Instagram belong to musicians.
- 81% of influencers on Instagram have 15,000-100,000 followers.
- The average number of Instagram followers on personal accounts is 150.
- 49.9% of Instagrammer accounts have between 1,000 and 10,000 followers.
Lesser-Known Facts About Instagram
- Facebook bought Instagram for $1 billion in 2012.
- Instagram had 72 million downloads in 2022, making it the most downloaded social media app.
- The most liked post on Instagram is a carousel of photos of Lionel Messi and his teammates after winning the 2022 FIFA World Cup, with over 61.2 million likes.
- In July 2023, Instagram launched Threads, which now has over 100 million users.
- Instagram posts with images reach an average of 2,706 users. Carousels reach an average of 2,350 and videos an average of 1,489 users.
- Carousel posts on Instagram get an average of 234 interactions. Image posts get an average of 215 and videos an average of 94 interactions.
- Photos with faces get 38% more likes.
- 10 selfies are posted on Instagram every 10 seconds.
- The most instagrammed food is pizza, followed by sushi.
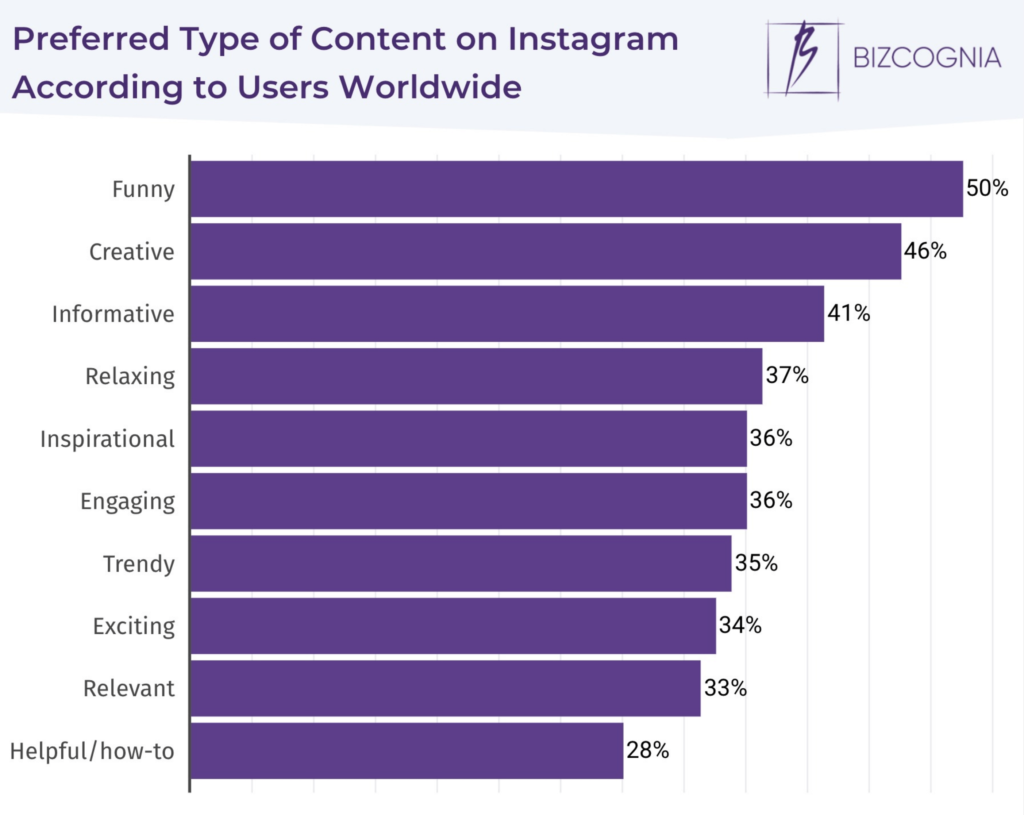
- 50% of Instagram users prefer funny posts. Creative and informative follow with 46% and 41%, respectively.
- Over 8% of Instagram accounts are fake and over 30% are inactive.
- You can’t follow more than 7,500 accounts on Instagram.
- 14% of drivers admit to using Instagram while driving.
- Clarendon is the most liked filter among US Instagram users.
- Instagram users were missing an average of 70% of their feeds after the chronological feed was canceled in 2016.
Who owns Instagram?
Instagram is owned by Meta Platforms, Inc., doing business as Meta, and formerly named Facebook, Inc., and TheFacebook, Inc.
When did Instagram come out?
Instagram originally came out on October 6th, 2010, amassing 25,000 users on the first day of its launch.
Who made Instagram?
Instagram was originally launched by co-founders Kevin Systrom and Mike Krieger.
How much is Instagram worth?
Instagram’s net worth is estimated at $1.2 million.