Very few of us would consider using a business without looking at its reviews first. We all want to know what people really think before we commit our time and money – so it’s no wonder that businesses are getting creative in an effort to attract positive reviews. These online reviews statistics reveal when, why, and where users leave reviews, as well as how businesses can and do make the most out of them.
Online Reviews Statistics 101
- 89% of consumers read online reviews before making a purchase.
- 79% of shoppers say they trust online reviews as much as personal recommendations.
- There is no major difference when it comes to the gender demographics of online review consumption; i.e. 90% of women say they read online reviews, compared to 88% of men.
- Most consumers read 1-3 reviews before deciding whether to hire a business.
- A business should have 11-50 reviews to feel trustworthy.
- 82% of shoppers are specifically looking for negative reviews.
- The majority of consumers are after a minimum star rating of 4 to consider using a business.
Online Review Usage Statistics
1. 43% of consumers are reading a business’s reviews when looking it up online.
34% do so always, while 21% will read the reviews occasionally. Only 2% never read the reviews associated with a business when looking it up online.
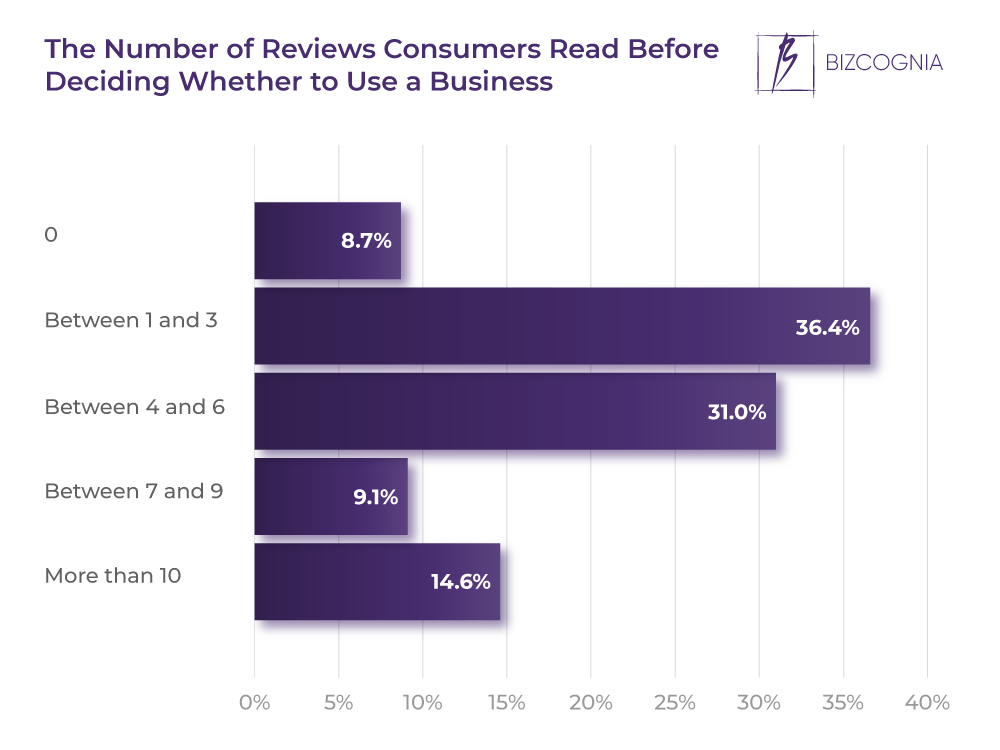
2. Most consumers (36.4%) read 1-3 reviews before deciding whether to use a business.
The second largest group (31%) read between 4 and 6 reviews, while 14.6% read over 10 of them. 9.1% of consumers read 7-9 reviews, while a close 8.7% don’t read any reviews before deciding whether to use a business.
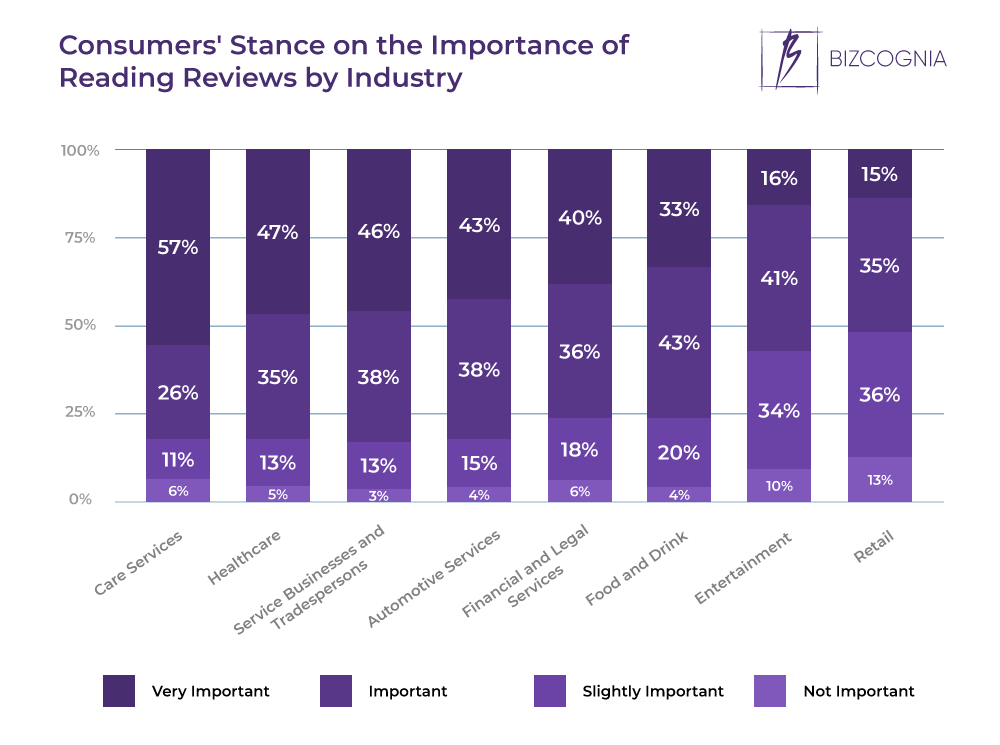
3. 57% of consumers say reading reviews for businesses offering care services is very important.
Online review statistics reveal that businesses with caregiver agency business models are closely followed by businesses in the healthcare and service and trade industry, for which a respective 47% and 46% of consumers find reading reviews very important. At 16% and 15%, respectively, entertainment and retail are the industries in which the least consumers find it very important to read reviews.
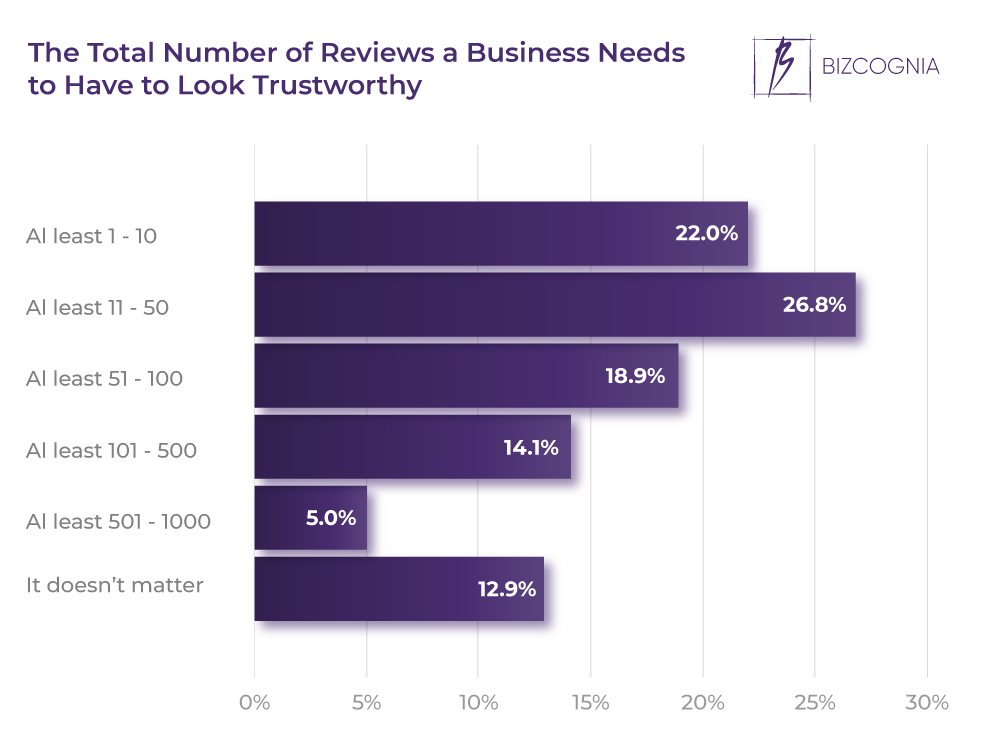
4. 26.8% of consumers say a business should have 11-50 reviews to feel trustworthy.
22% settle for up to 10 reviews, while 18.9% of consumers say that 51-100 reviews are needed to prove trustworthiness. 14.1% are after 101-500 reviews, while a mere 5% consider 501-1000 reviews as a trust signal. On the other hand, 12.9% of consumers say that the total number of reviews doesn’t matter.
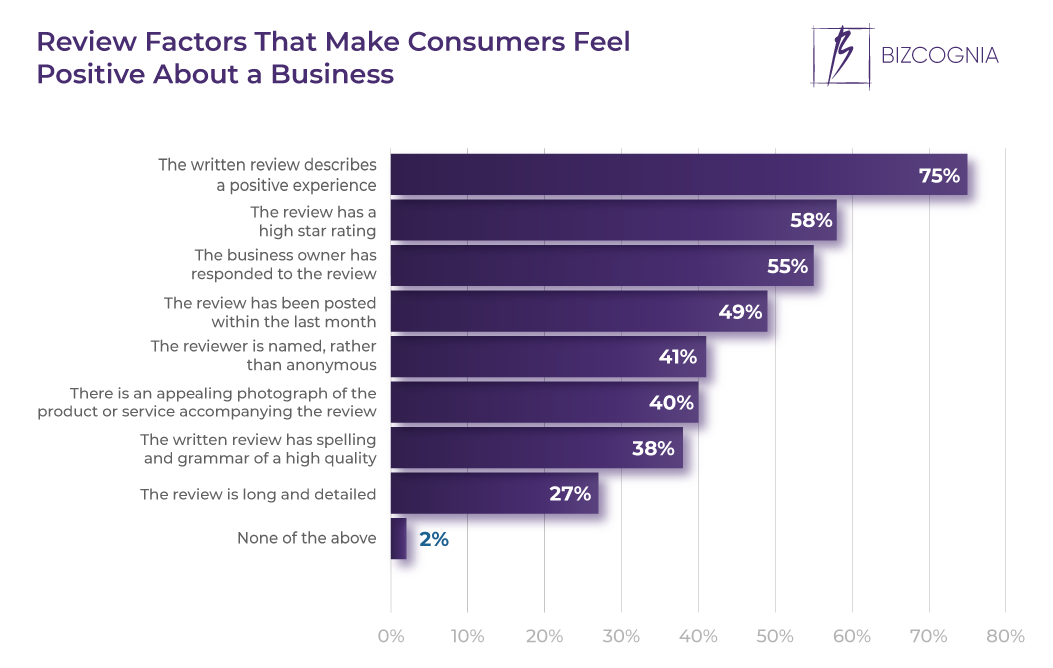
5. For 75% of consumers, a review describing a positive experience is the main factor to make them feel positive about a business.
A high star rating and a reply from the business follow as the most important factors for 58% and 55% of consumers, respectively. Being posted within the last month, being written by a named (as opposed to an anonymous) reviewer, and being accompanied by an appealing photograph are the main review factors for respective 49%, 41%, and 40% of consumers. According to statistics about online reviews, proper spelling and grammar, as well as long and detailed reviews rank last, viewed as the most important factors by 38% and 27% of consumers, respectively.
6. 82% of shoppers are specifically looking for negative reviews.
Once they find them, they spend 4X the time they otherwise would on the site and convert 67% better! Furthermore, 62% of consumers say they will not support brands that engage in review censorship.
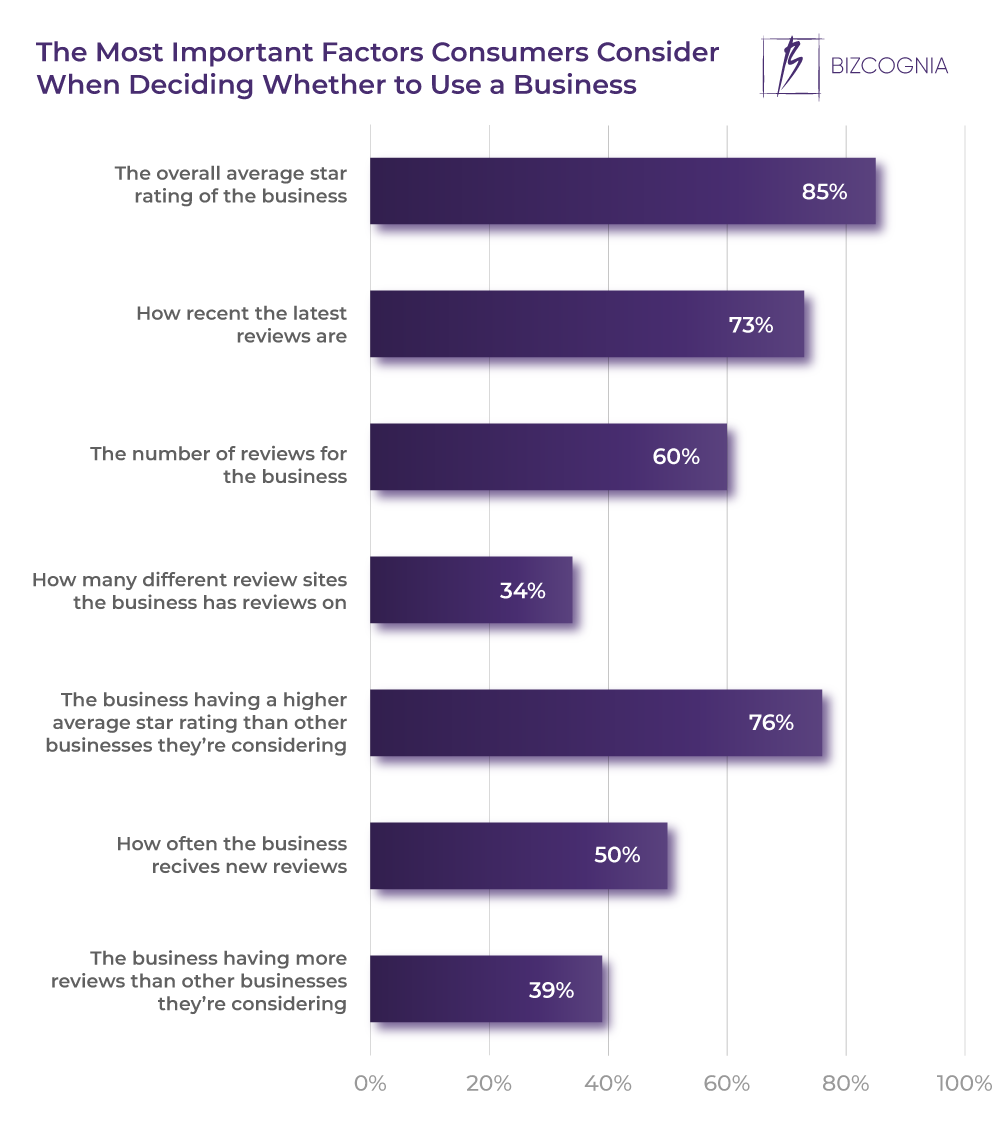
7. When deciding whether to use a business, the average star rating is the most important factor for 85% of consumers.
Having a higher average star rating ranks second (76%), while review recency ranks third (73%). The total number of reviews and how often the business receives them follow at 60% and 50%, respectively. A business having more reviews than others being considered and the number of different sites it has reviews on rank last, with respective 39% and 34% of consumers considering it the most important factor when deciding whether to use a business.
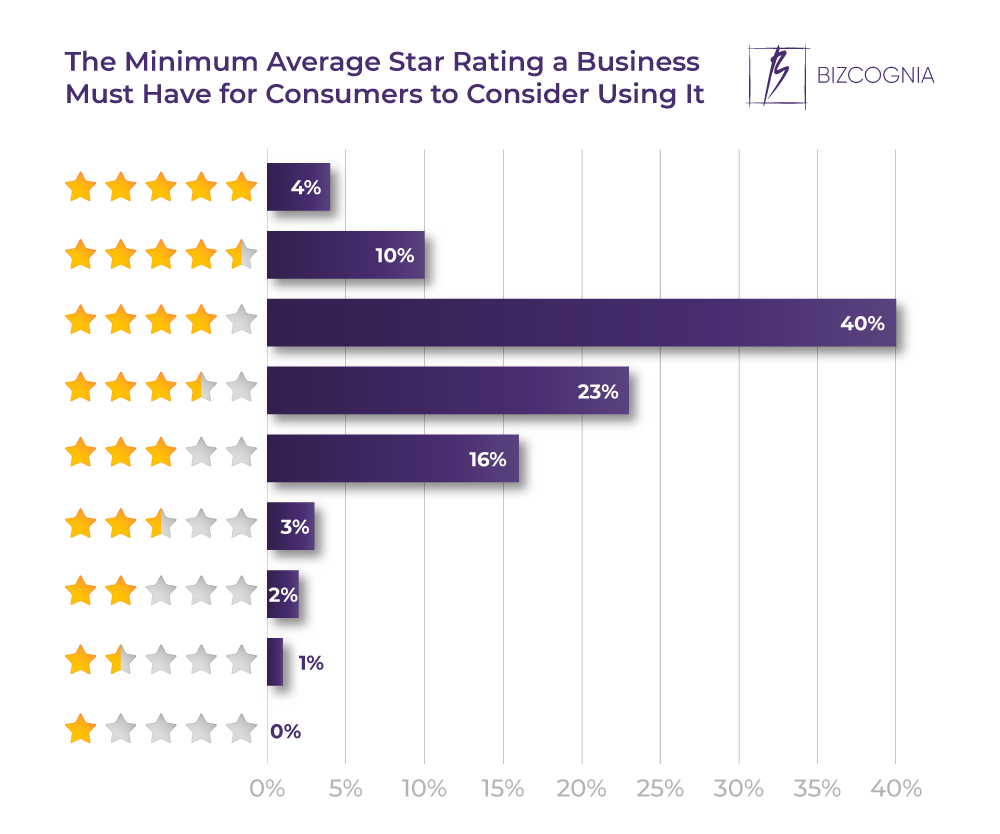
8. The majority of consumers (40%) are after a minimum star rating of 4 to consider using a business.
3.5 stars follow with 23% of consumers, while 3 stars is the acceptable minimum for 16% of consumers. 10% won’t settle for less than 4.5 stars, while 4% have their standards set at 5 stars. 2.5, 2, and 1.5 stars are acceptable to 3%, 2%, and 1%, respectively, while no one would consider using a business with no star rating.
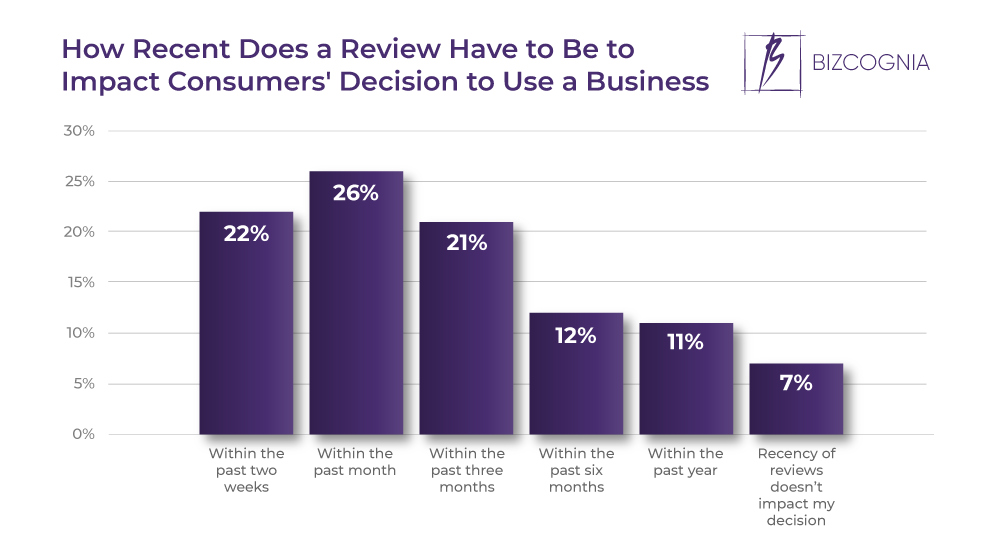
9. 26% of consumers say that, to affect their decision to use a business, a review should be posted within the past month.
A respective 22% and 21% say the same for reviews within the past two weeks and three months. Reviews written within the past six months are good enough for 12%, while 11% will settle for ones written in the past year. Only 7% of consumers say that review recency doesn’t affect their decision-making.
Online Review Prompts & Incentives
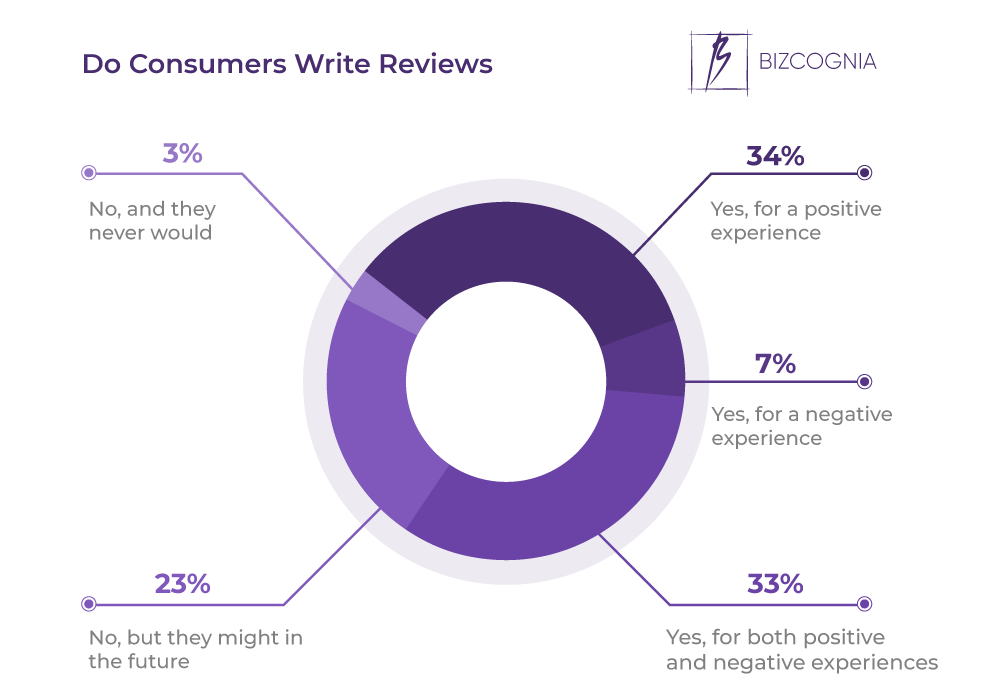
10. 33% of consumers write reviews regardless of their experience with a business.
On the other hand, 34% write reviews for positive experiences only, while 7% do so for negative experiences. 23% don’t write reviews but might in the future, while a mere 3% don’t and never would.
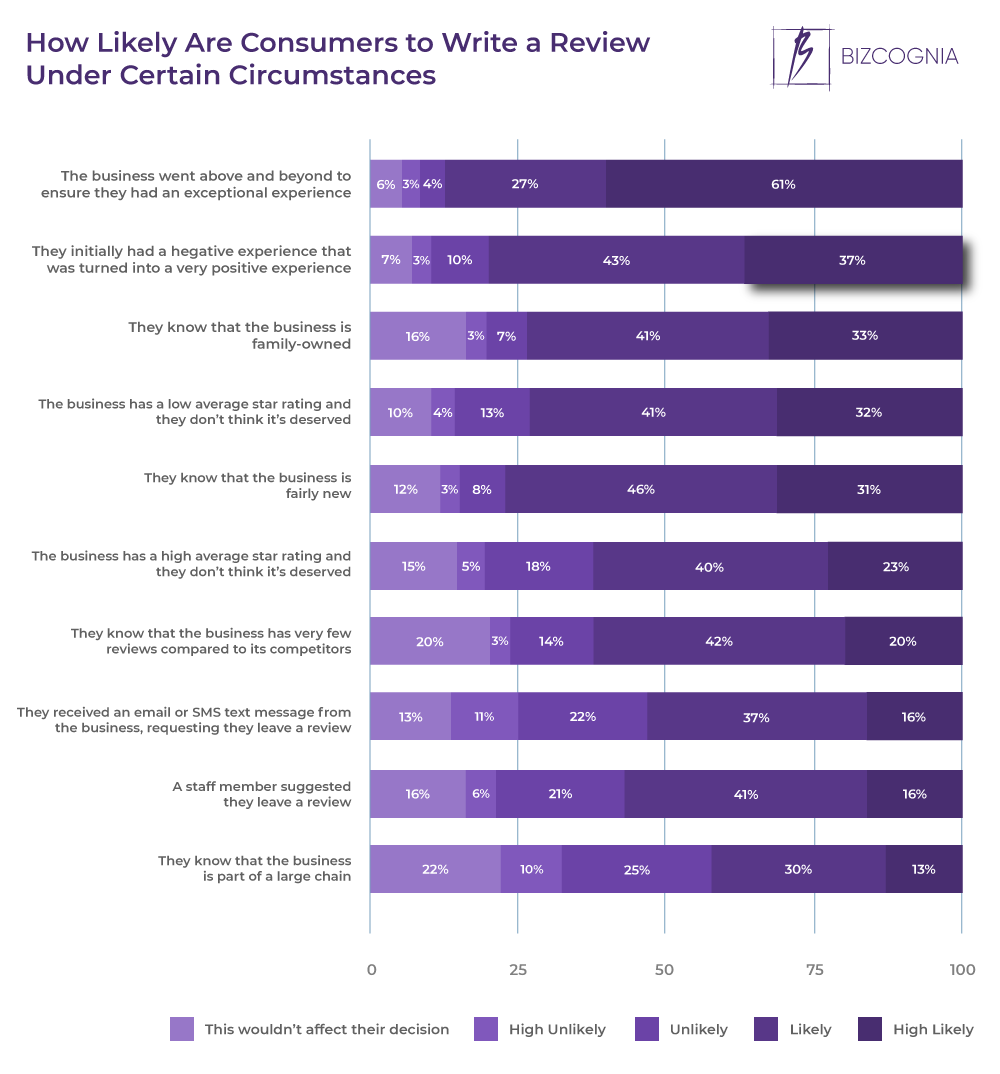
11. 61% of consumers are highly likely to write a review for a business that went above and beyond to ensure they had an exceptional experience.
Other reasons why consumers are very likely to leave a review include an initially negative experience turned positive (37%), as well as knowing that a business is family-owned (33%). Consumers are also highly likely to write a review for a business with a relatively low star rating that consumers don’t think is deserved (32%) or the opposite (23%). Knowing that a business is relatively new or has fewer reviews than competitors makes it likely for 20% of consumers to leave a review, while the least dominant reasons to do so include: receiving an email or text review request by the business or a staff member (16% each), as well as knowing that the business is part of a large chain (13%).
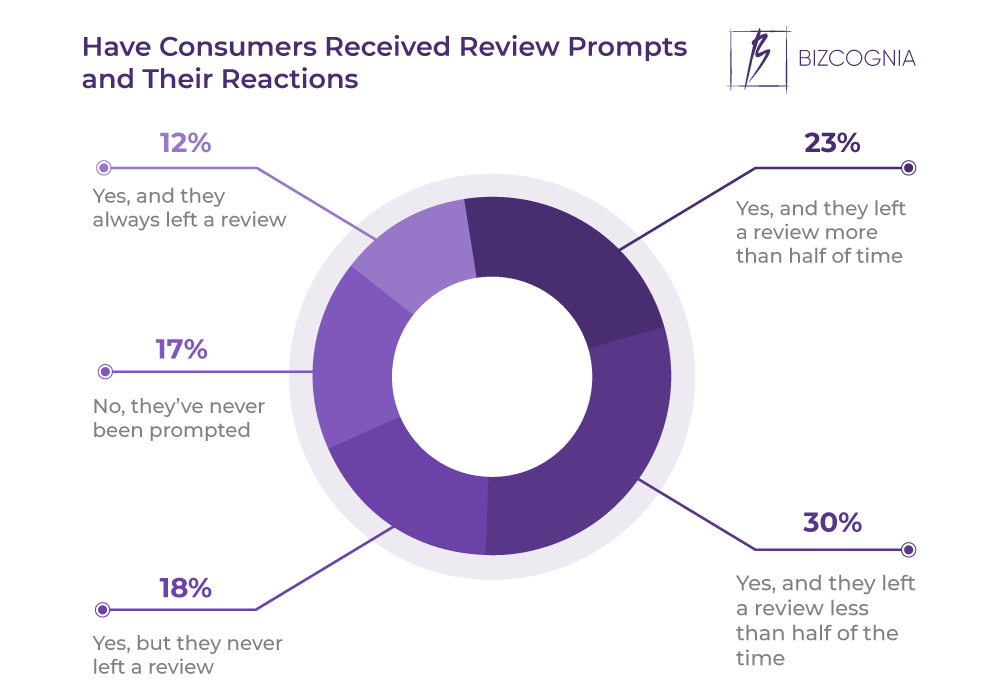
12. 30% of consumers have been prompted to write a review and have done so in less than 50% of cases.
Among others who’ve been prompted to write a review, 23% have done so in more than 50% of cases, 18% never wrote a review, while 12% always do. On the other side of the spectrum, 17% of consumers haven’t been prompted to leave a review.
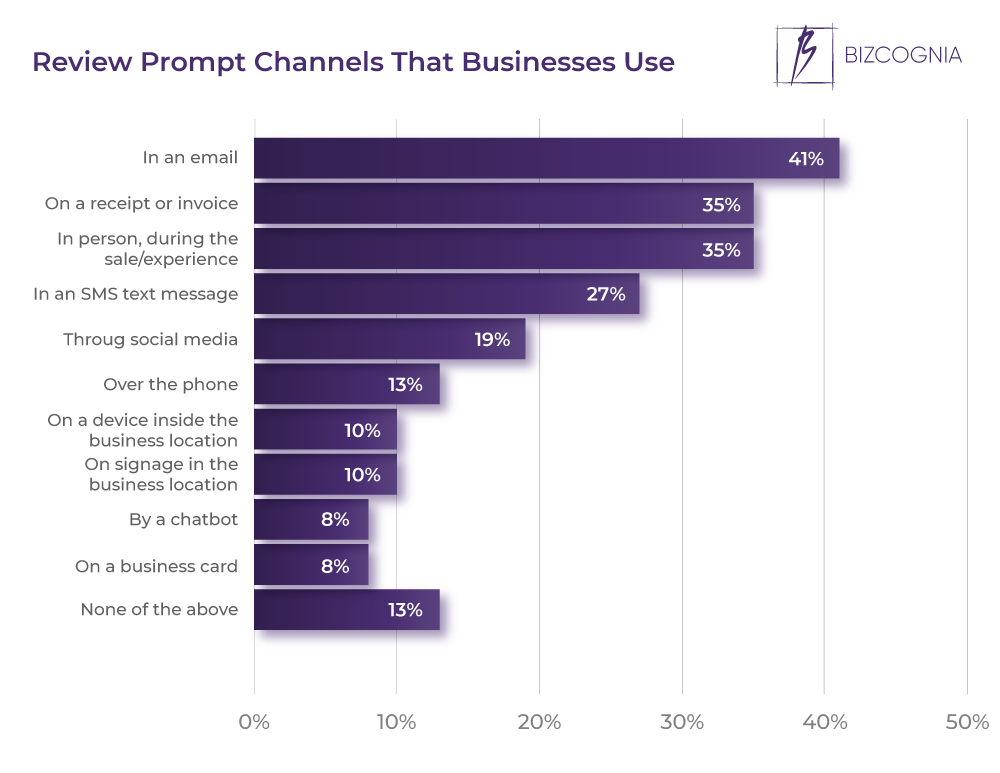
13. 41% of consumers receive review prompts via email.
Receipts/invoices and in-person prompts rank second at 35% each, followed by text message prompts (27%). Social media and phone rank round the fifth spot, at 19% and 13%, respectively. Review prompts are least commonly found on devices and signage in the location (10% each), as well as chatbots and business cards (8% each).
14. Up to 80% of online reviews come from follow-up emails prompting customers to review their purchases.
When it comes to how these reviews perform, over 60% of prompted ones come with 5-star ratings, and less than 20% have 3-star ratings or less. In fact, prompted reviews have an average rating of 4.34 as opposed to the one of 3.89 by users that haven’t been encouraged to write a review. What’s more, prompted reviews increase purchase likelihood by 15% when listed as written by verified buyers as opposed to anonymous reviews.
15. 17% of businesses use discounts to incentivize consumers to write reviews.
Gifts/free service is the second-most-popular method, at 15%. Cash is used as a review incentive by 6% of businesses.
Online Review Platforms & Trustworthiness
16. Google is the top business review platform.
88% of all online reviews are hosted on four websites. Google tops the list, hosting a whopping 73% of them. Yelp ranks second at 6%, while Facebook and Trip Advisor share the third place with 3% each.
17. Product reviews on third-party platforms are somewhat more trusted than ones on a retailer’s website.
Product review statistics reveal that this is the stance of 41.7% of consumers. 16.9% trust third-party reviews more depending on the influencer or the account posting the review. The same portion of consumers doesn’t trust reviews on third-party platforms over ones on a retailer’s website, while 16.6% say the opposite. Finally, 7.9% of consumers trust third-party reviews more if they can tell that the reviewer actually used the product.
18. 38.8% of consumers somewhat trust sponsored reviews on social media.
The second-largest group (32.7%) doesn’t trust sponsored reviews at all, while the smallest consumer group (6.1%) says the opposite. The trust of 13.3% of consumers depends on the influencer/account posting the review, while 9.1% say the same for cases where they can tell the reviewer has actually used and liked the product.
Fake Online Reviews Statistics
19. 62% of consumers believe they’ve seen a fake review of a business.
Further 29% aren’t sure, while a mere 9% believe they haven’t. Another 62% of consumers say fake reviews should be removed, while 67% say that fake reviews make them doubt online reviews in general.
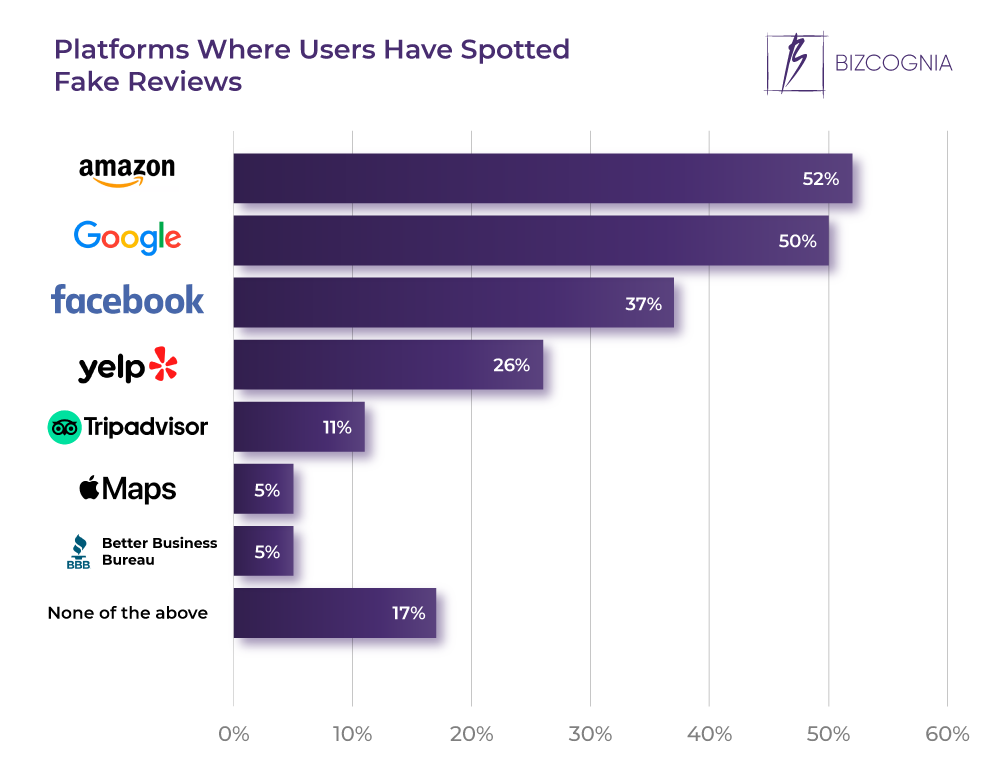
20. 52% of consumers have seen a fake review on Amazon.
This is the highest percentage across platforms and reflects the scale and open nature of the Amazon business model, which relies heavily on third-party sellers alongside its own retail operations. With millions of listings and seller-generated content, moderating fake reviews becomes significantly more complex. According to Google review statistics, the search giant ranks second, with 50% of consumers reporting they’ve seen fake reviews there as well. At just 5% each, Apple Maps and the BBB report the fewest incidents, likely due to tighter control over listings and a smaller review volume.
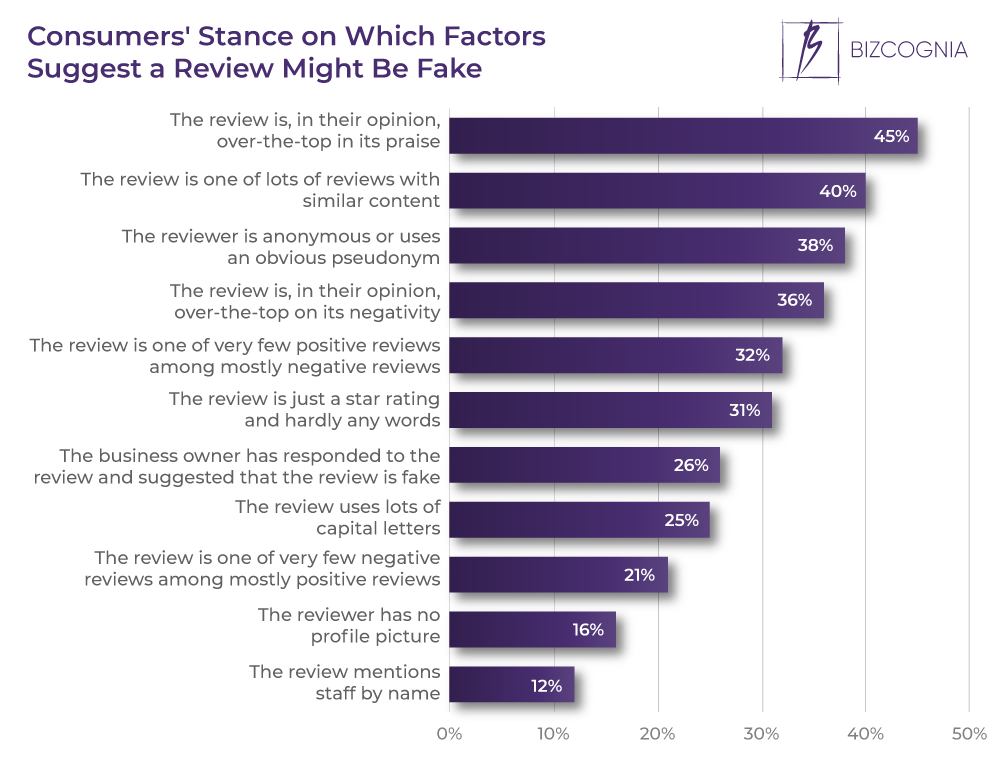
21. 45% of consumers think that reviews with excessive praise might be fake.
36% of consumers think the same about reviews with excessive negativity. Other types of reviews that raise a red flag are ones with similar content to many of the rest (40%), ones written by anonymous reviewers (38%), or ones without a profile photo (16%).
Fake reviews statistics further show that a positive review among mostly negative ones is suspicious for 32% of consumers, while the opposite goes for 21%. 31% doubt reviews with only star ratings and very few words, while 25% feel the same about reviews written in all caps. A business owner responding that the review is fake is a red flag for 26% of consumers, while the same applies to reviews mentioning staff by name for 12% of consumers.
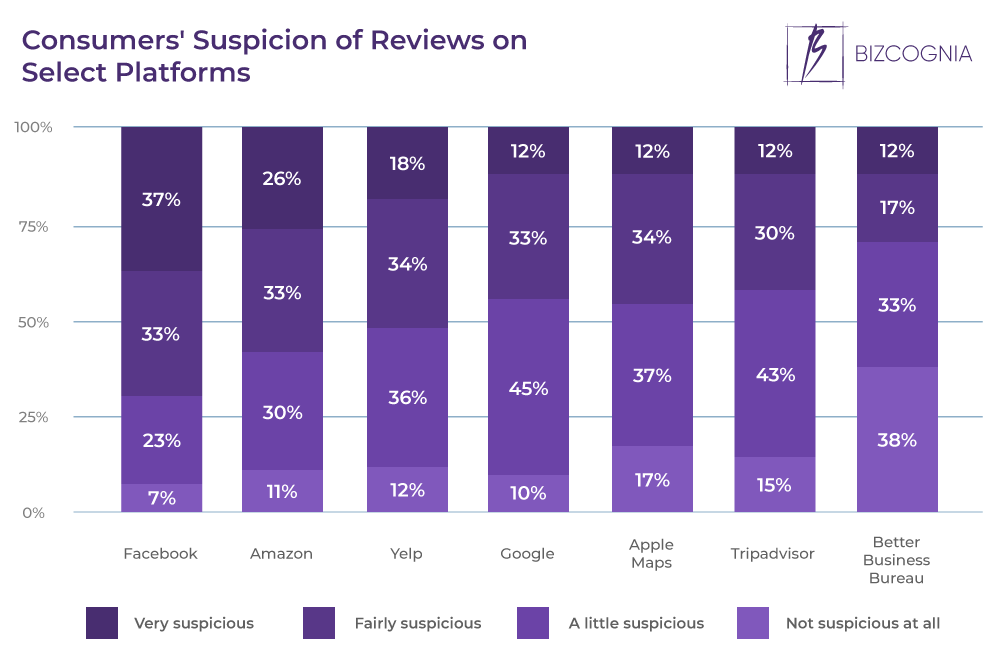
22. 37% of consumers are very suspicious of reviews left on Facebook.
Online user reviews statistics reveal that Amazon ranks second at 26%, followed by Yelp at 18%, while Google, Apple Maps, Trip Advisor, and the BBB share the fourth spot at 12% each. On the other side of the spectrum, 37% of consumers are not suspicious at all of the reviews left on the BBB.
Online Review Responsiveness & Purchase Intent
23. Displaying online reviews can boost conversions by 270%.
The purchase likelihood for a product with as few as five reviews is nearly 3X greater than the one for a product with no reviews. This statistic reveals just how crucial social proof is for retailers and brands that operate under an ecommerce business model.
24. Online reviews have a greater impact on purchase likelihood for higher-priced items than cheaper ones.
According to online reviews statistics, displaying reviews for products in low-priced categories can boost conversions by 190%. Doing the same for high-priced products, however, increases conversion rates by a whopping 380%. Reviews also have a greater impact on purchase likelihood for high-consideration products as opposed to low-consideration ones. Besides pricing, factors that define a purchase as a high-consideration one and cause consumers to read more online reviews include:
- the product’s effect on health and safety;
- the product’s alignment with the consumer’s personal identity;
- whether the purchase is recurring or habitual;
- whether it’s a recently-introduced product or brand.
25. Across product categories, purchase likelihood typically peaks at ratings in the 4.0 – 4.7 range with over 50% of consumers saying that review scores below 5.0 are more authentic.
As counterintuitive as it sounds, online review statistics show that purchase likelihood gradually decreases as online review ratings reach 5.0. In fact, products with an average rating in the 4.2 – 4.7 range are more likely to be purchased than those in the 4.7 – 5.0 range. Finally, 60% of consumers say they will continue to do research on a product with 5.0-star rating reviews.
26. A purchase likelihood increase only occurs within the first 10 reviews, with the first 5 reviews driving the most of it.
When it comes to the cost of the product, high-priced items need at least 5 reviews to see the greatest conversion impact, while the conversion impact peaks at 2-4 reviews for cheaper products.
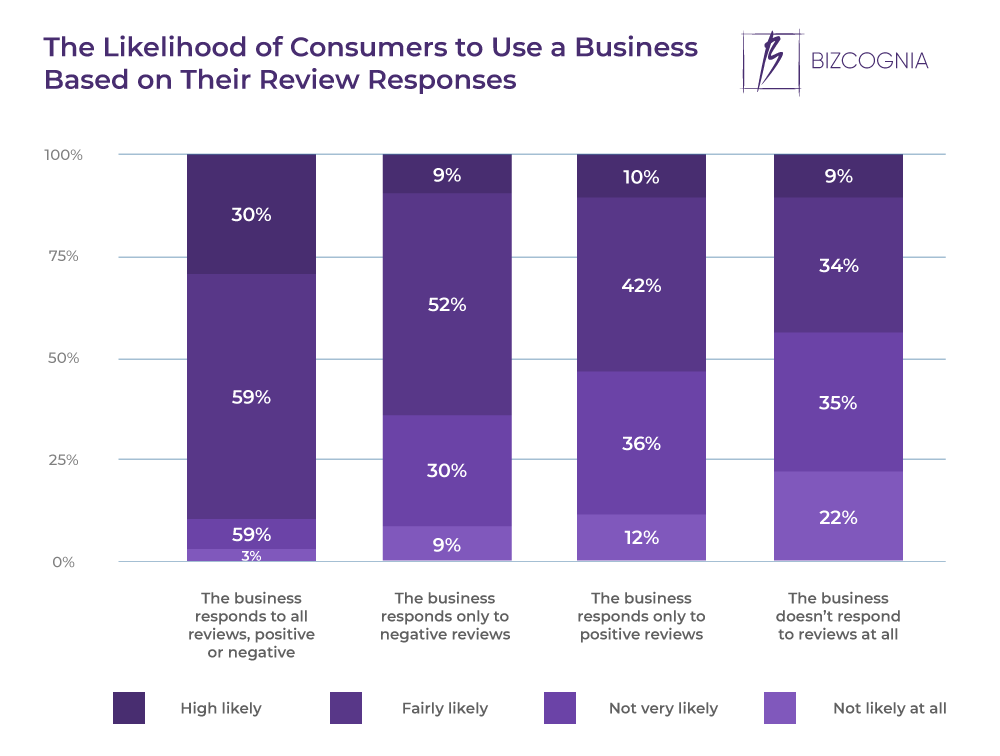
27. 30% of consumers are highly likely to use a business that responds to all reviews, regardless of whether they’re positive or negative.
On the other hand, online reviews statistics reveal 22% of consumers aren’t likely at all to use a business that doesn’t respond to reviews at all.
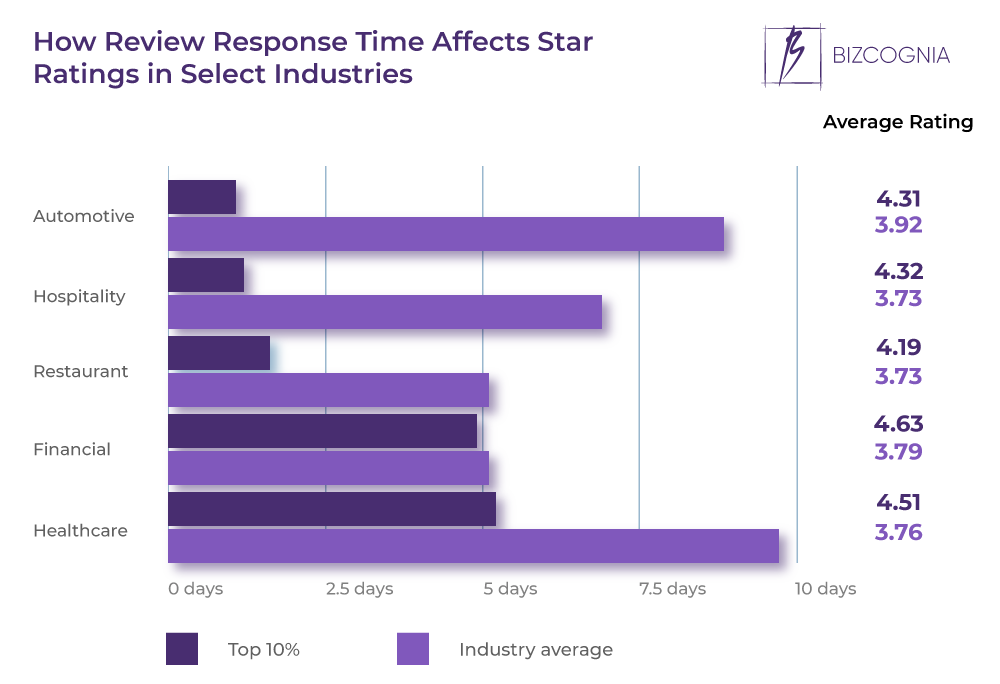
28. At a little under 10 days, on average, businesses in the healthcare industry are the slowest to respond to reviews.
Their average star rating is 3.76. However, the top 10% that make the effort to respond in around 5 days see an average star rating of 4.51. At around 9 days, the second slowest-to-respond are businesses in the automotive industry, with an average star rating of 3.92 that jumps to 4.31 for the top 10% that reduce review response time to about a day.
According to online review statistics, businesses in the restaurant and hospitality industries have an average star rating of 3.73 each, for respective review response times of 5 and 6.5 days each. The top 10% in the restaurant industry shorten their response time to 1.5 day and see their rating reach 4.19, while the figures for hospitality businesses stand at around a day and 4.32.
Businesses in the financial industry are the only ones where shortening the review response time for less than a day raises average star ratings from 3.79 to 4.63.
Online Reviews in Summation
The above online reviews statistics make it crystal clear that reviews can either make or break a business. There’s more to them than star ratings, and business owners should be aware of all the ways they can make the most out of them. This includes things like when and how they’ll respond to them, as well as the methods in which they can incentivize clients to write them in the first place. When done right, online reviews are one of the cheapest marketing tools a business owner can have in their suite.
Online Reviews FAQ
What percentage of consumers write reviews?
Online review statistics reveal that an estimated 5-10% of consumers write reviews. While that might look like a small portion, it actually translates to about 20% of the total ecommerce sales worldwide. If we consider that international ecommerce sales stand at around $2 trillion, a whopping $4 billion of that revenue comes from online reviews alone.
How many people trust a business more after reading positive online reviews?
With 89% of consumers reading online reviews before making a purchase, and a further 79% saying they trust them as much as personal recommendations, it’s safe to say that the vast majority of consumers trust a business more after reading positive online reviews.
How much do online reviews affect sales?
Online review statistics reveal that online reviews boost online sales by 18%.
How effective are online reviews?
63% of consumers are more likely to make a purchase from a website that has online reviews in place. What’s more, they trust reviews 12X more than product descriptions. Finally, websites that display online reviews see a 270% increase in conversions.
What percentage of Google reviews are fake?
According to Google review stats, 10.7% of reviews on the platform are fake, even though the platform removed about 130 million of them between 2019 and 2020.
What percentage of online reviews are negative?
While there are no specific figures as to the proportion of negative reviews online, a whopping 82% of shoppers are specifically looking for them. As counterintuitive as it sounds, once consumers come across negative reviews, they spend 4X the time they otherwise would on the site and convert 67% better!
What percentage of happy customers leave reviews?
Online reviews statistics reveal that 34% of consumers will leave a review after a positive experience only. This is immediately followed by another 33% that will write a review regardless of their experience with a business.
Sources: Oberlo, Spiegel Research Center, BrightLocal, ReviewTrackers, USA Today, The World Financial Review, CompuKol, MediaPost