Getting website traffic can be challenging, but getting that traffic to convert into taking the action you want is an even bigger struggle. All business owners with an online presence need a good CRO strategy to generate revenue, as conversion rates as one of the most important sales funnel metrics.
The CRO statistics below to discover what works and what doesn’t when it comes to converting your traffic into the leads your business needs.
CRO Statistics – The Highlights
- The global average conversion rate is 2.6%.
- Search traffic generates the highest average conversion rate of 2.8%.
- The global CRO software market reached $1.2 billion in 2022.
- At 43%, collecting enough data is the biggest challenge for successful lead conversion.
- At 80.8%, low conversion rates are the primary reason for redesigning a website.
- UX design can increase conversion rates by as much as 400%.
- Personalization is reported to increase conversion rates for 93% of companies.
- Almost 40% of companies follow a structured process for conversion optimization.
General Conversion Rate Optimization Statistics
The global average conversion rate is 2.6%.
Data by region reveals that this figure is highest in Great Britain, at 3.3%. The US follows with 2.7%, while EMEA and other regions report average ecommerce website conversion rates of 1.6% and 1.4%, respectively.
The average mobile conversion rate worldwide is 2.2%.
The above figure is much lower than the one on desktop, which stands at 3.4%, and the one on tablet at 3%.
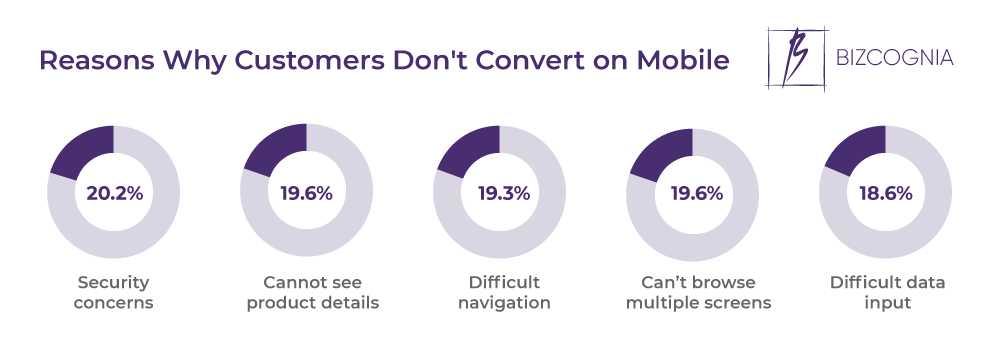
Sales conversion rate statistics reveal that the primary reasons for not converting on mobile are security concerns, at 20.2%. Not being able to see product details and not being able to browse multiple screens to compare rank second, with 19.6% each. Difficult navigation follows closely with 19.3%, while difficult detail input rounds the list with 18.6%.
Search traffic generates the highest average conversion rate of 2.8%.
Data on website conversions by source reveals that direct traffic and email follow closely, with 2.5% and 2.2%, respectively, while conversion rates through social traffic stand at a mere 0.8%.
Understanding the SEO agency business model can help explain this outcome. These agencies rely heavily on organic search performance as a core revenue driver and optimize sites to capture high-intent traffic that’s already primed to convert. The state above demonstrates that SEO isn’t just about visibility, but a powerful engine for conversion strategy.
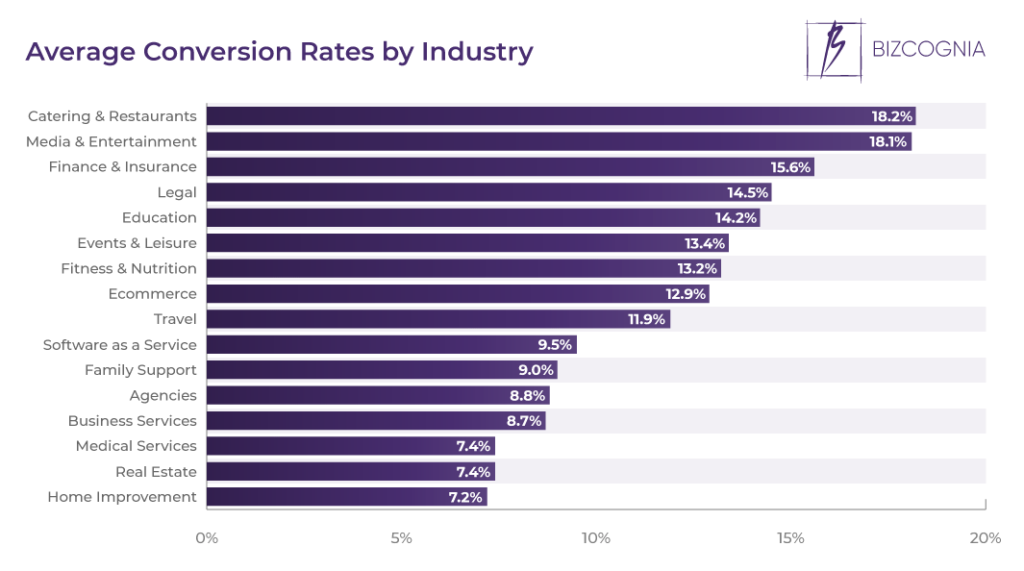
The catering and restaurant industry sees the highest average conversion rates at 18.2%.
When observing website conversion rates by industry, the media and entertainment industry makes a close cut at 18.1%. CRO stats reveal that the finance and insurance industry ranks third with an average conversion rate of 15.6%, while the legal and education industries round up the top five with 14.5% and 14.2%, respectively.
Home improvement, medical services, and real estate are the industries with the lowest average conversion rates.
At 7.2%, home improvement reports the lowest close rate by industry. The real estate and medical services industry outrank it by a thread, at 7.4% each.
The global CRO software market reached $1.2 billion in 2022.
Between 2022 and 2032, the global conversion rate optimization software market is projected to grow at a compound annual growth rate of 11.6%, reaching $3.7 billion.
Region-wise, North America leads the market with a 40% share. In fact, the US CRO software market is expected to reach $1.3 billion by 2032.
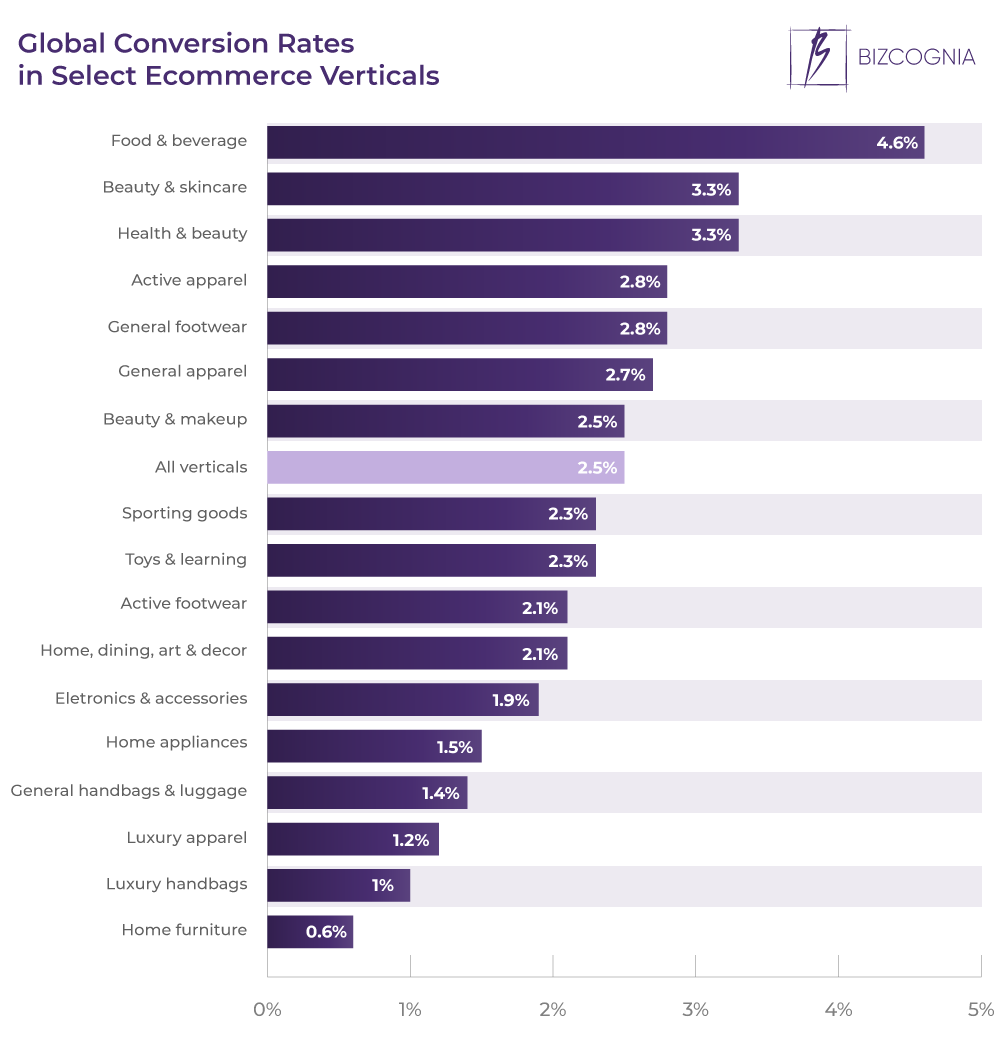
The food and beverage sector has an online shopping conversion rate of 4.6%.
Data on ecommerce conversion rates by industry reveals that categories like beauty and skincare and health and beauty also have high-converting websites, with 3.3% each.
On the other hand, luxury handbags and home furniture have the lowest online shopping conversion rates at 1% and 0.6%, respectively.
Google Ads boasts a 3.75% conversion rate.
Data on PPC conversion rates reveals Google outperforms Bing (2.94%) in conversions by over 27%.
The average conversion rate of Facebook Ads across all industries is 9.21%.
According to social media conversion rate statistics, the fitness industry performs best on Facebook, with conversion rates of 14.21%.
It’s closely followed by education at 13.57%, while employment and job training ranks third at 11.73%.
At 2.31%, technology is the industry with the lowest conversion rates in Facebook Ads.
Lead and Landing Page Conversion Rate Statistics
The landing page conversion rate across industries averages 2.35%.
The top 25% of landing pages boast a conversion rate of 5.31% or higher, while the top 10% convert at 11.45%.
62% of B2B companies report having up to six landing pages.
Furthermore, 44% of the clicks on the websites of companies that use a B2B business model are pointed to their homepages as opposed to a special landing page. Landing page statistics further reveal the lack of knowledge or an overloaded marketing team as the main reasons for not using landing pages.
A higher number of landing pages results in increased leads.
Landing page conversion statistics indicate a 55% increase in leads when companies increase the number of landing pages from 10 to 15. Having over 40 landing pages yields the best results, especially for B2B businesses.
To generate the highest number of conversions, the optimal number of form fields on a landing page is three.
Even though data suggests that the average number of form fields on a landing page is 11, reducing it to four can increase conversions by a whopping 120%.
Removing the navigation bar from a landing page can double conversions.
Yet, an incredible 84% of landing pages have a navigation bar.
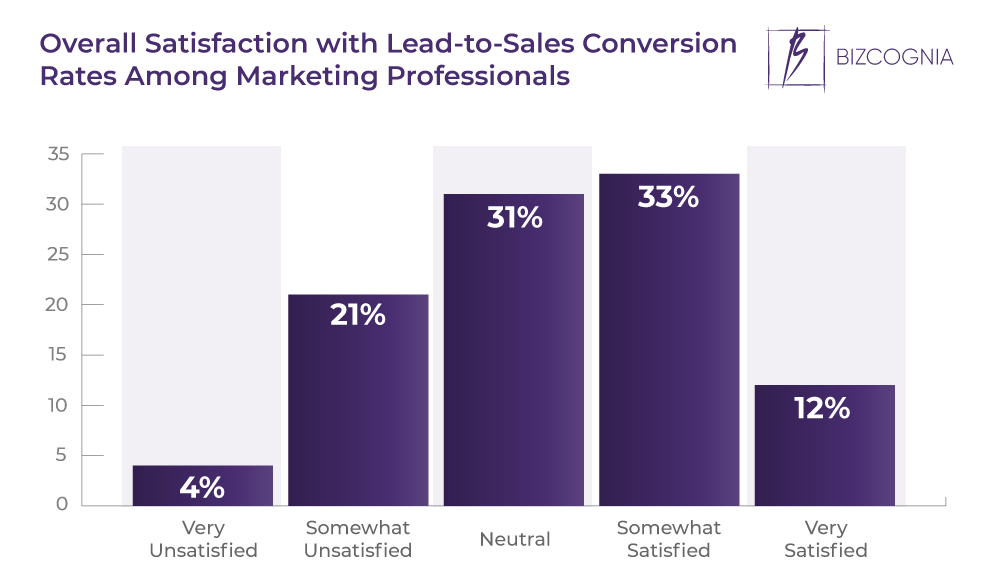
Only 12% of brands are very satisfied with their average lead conversion rates.
About a third of companies claim they are somewhat satisfied with their lead-to-sales conversion rate. 31% are neutral, 21% are somewhat unsatisfied, and a mere 4% are very unsatisfied.
Read more: Sales Funnel Conversion Rate
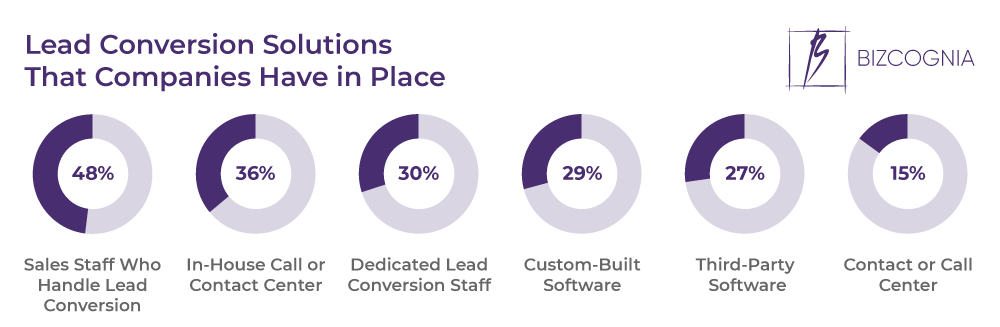
48% of companies have sales staff that handles the lead conversion process as part of their job.
In-house call or contact centers are the second-most-popular options, present in 36% of companies, followed by dedicated lead conversion staff, present in 30%.
Respective 29% and 27% of companies rely on custom-built or third-party software, while 15% rely on a contact or call center, or similar setups that follow the sales agency business model, where lead conversion is handled by a structured and specialized team.
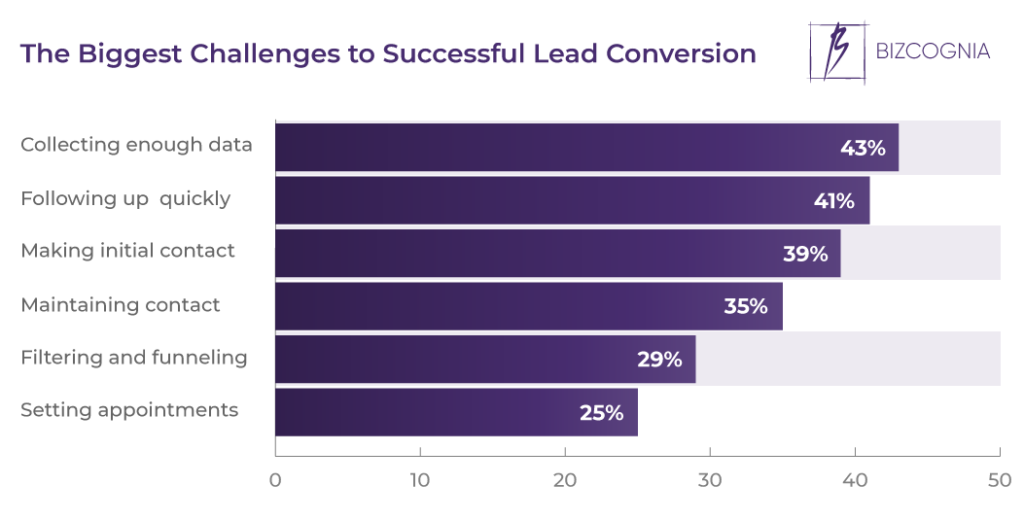
At 43%, collecting enough data is the biggest challenge for successful lead conversion.
Other obstacles to a satisfactory lead conversion rate include quick follow-ups and initial contacts at 41% and 39%, respectively.
Another 35% of organizations report maintaining lead contact as one of the biggest challenges to lead conversion, followed by lead filtering and funneling and setting appointments, at 29% and 25%, respectively.
At 54%, missed revenue opportunities rank on top of the greatest costs related to lead conversion challenges.
Wasted staff time/resources ranks second, as agreed by 50% of marketing and sales professionals, followed by wasted budget with 36%.
Equal 29% portions of marketing and sales professionals say lower employee morale and contention between marketing and sales are some of the greatest costs related to lead conversion challenges.

CRO Strategy Statistics
Welcome emails boast a conversion rate of 0.94%, whereas other marketing emails have a 0.10% sales conversion rate.
Email marketing statistics reveal that three-quarters of new subscribers expect to get a welcome email, but only 57.7% of brands send them. Welcome emails that include an offer can increase revenue by 30% compared to plain ones. Welcome email receivers show 33% more engagement compared to others, and welcome emails generate up to 320% more revenue than other promotional emails.
Browse abandonment emails have the lowest conversion rate of 4.10%.
At 24.58%, ‘Email My Cart’ campaigns score the highest in terms of average email marketing conversion rates. The second-best-performing are shopping cart abandonment emails, with conversion rates of 18.54%.
Consumers need an average of three sessions before they convert.
According to sales statistics, online shoppers want to have all the necessary information before completing a purchase. When working on improving conversions, brands should analyze people’s shopping behavior and find opportunities for optimization.
Additionally, online reviews statistics reveal that 78% of consumers will read this type of content before making a purchase.
At 80.8%, low conversion rates are the primary reason for redesigning a website.
When it comes to the top reasons for hiring professional web designers, however, website conversion optimization ranks third at 19.2%.
When properly executed, UX design can increase conversion rates by as much as 400%.
To achieve satisfactory sales conversions, brands need to be aware that it’s important for users to be satisfied with the experience they get from a website. Therefore, businesses need to adjust and take UX seriously in order to attract more customers and increase ROI.
Interactive content converts nearly 2X better than static.
CRO facts reveal that 60% of marketers have adopted interactive content strategies. They’ve already noticed the difference that dynamic content generates conversions moderately or very well 70% of the time, as opposed to passive content, which does so only 36% of the time.
Personalization is reported to increase conversion rates for 93% of companies.
This figure only makes sense if we consider that 54% of users prefer personalized over generic online experiences.
When it comes to ideas on how to execute personalization, here’s some food for thought – 59% of shoppers would like to see real-time deals on items they like.
CRO stats also reveal that 44% of consumers say they’re likely to become repeat buyers after a personalized experience with a brand.
Speed can increase website conversion rates and customer engagement.
Speed is nothing new among conversion rate optimization best practices.
Recent studies show that a mere 0.1-second speed improvement can yield an 8.4% increase in mobile conversion rates in the retail industry. The corresponding figure for travel is 10.1%, and 3.6% in the luxury industry.
Meanwhile, other studies show that a one-second page load delay can reduce conversions by 20% in retail.
User-generated content increases conversion rates by 161% across industries.
Conversion rate optimization statistics reveal that, when it comes to the average sales conversion rate increase in specific industries, apparel performs best with a 207% conversion boost after shoppers see user-generated content.
Health and beauty and food and tobacco rank second at 203% each. The sporting goods industry ranks third with a 165% increase, followed by electronics at 81%. It’s no wonder that UGC is a go-to sales conversion strategy among conversion rate optimization agencies.
Brands using visual content report 7X higher conversion rates than those that don’t.
When it comes to the types of visual content, CRO statistics reveal that 360-degree rotating images can increase conversion rates by as much as 27%.
Product videos seem to be much more effective, as they are reported to yield a conversion increase of a whopping 134%.
CRO Workflow Statistics
Almost 40% of companies follow a structured process for conversion optimization.
A little over 20% of companies don’t follow a conversion rate optimization process. What’s interesting is that out of those who do have a process in place, there’s a 50:50 ratio between those who document/structure it (39.6%) and those that don’t (39.3%).
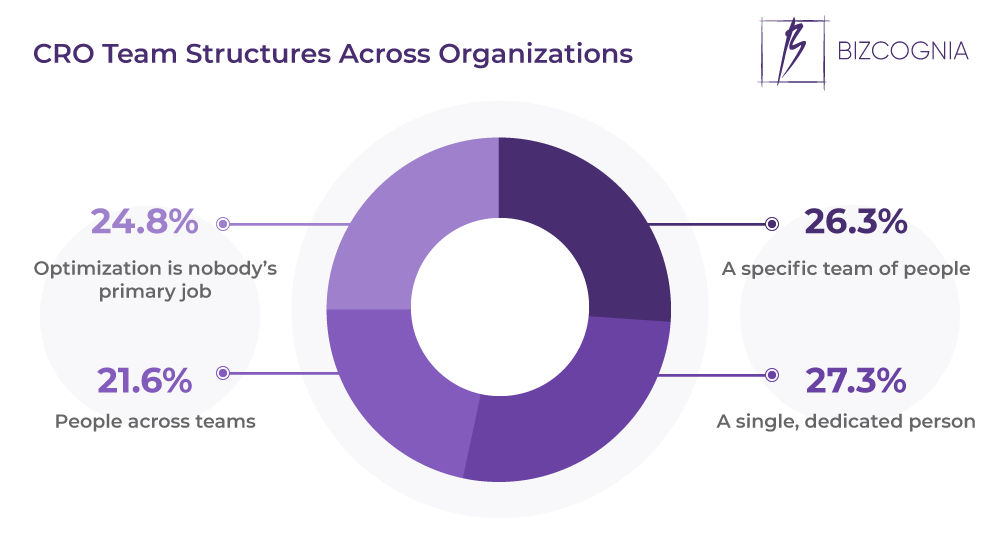
27.3% of companies’ CRO efforts are led by a single dedicated person.
According to the latest conversion rate optimization trends, 26.3% of companies appoint a specific team of people to deal with CRO, while 21.6% of companies assign people across teams.
Interestingly, 24.8% of companies report that CRO is nobody’s primary job.
Agencies and freelancers use a documented, structured conversion optimization process more often.
CRO stats reveal that 42% of agencies and freelancers rely on a documented, structured conversion optimization process compared to about 36% of in-house marketers.
When it comes to having an undocumented process, there’s a negligible difference between agencies/freelancers and in-house marketers (with over 38% and 40%, respectively).
Finally, in-house marketers’ share among those who don’t have a CRO process in place stands at around 24%, compared to the one of agencies/freelancers standing at around 18%.
Nearly every conversion optimization team runs A/B tests.
This is followed by the teams who test more than one variation (A/B/n) at 38%, while multivariate and bandit testing remains the least popular types of tests, being run by about a quarter and less than 10% of teams, respectively.
Working in CRO
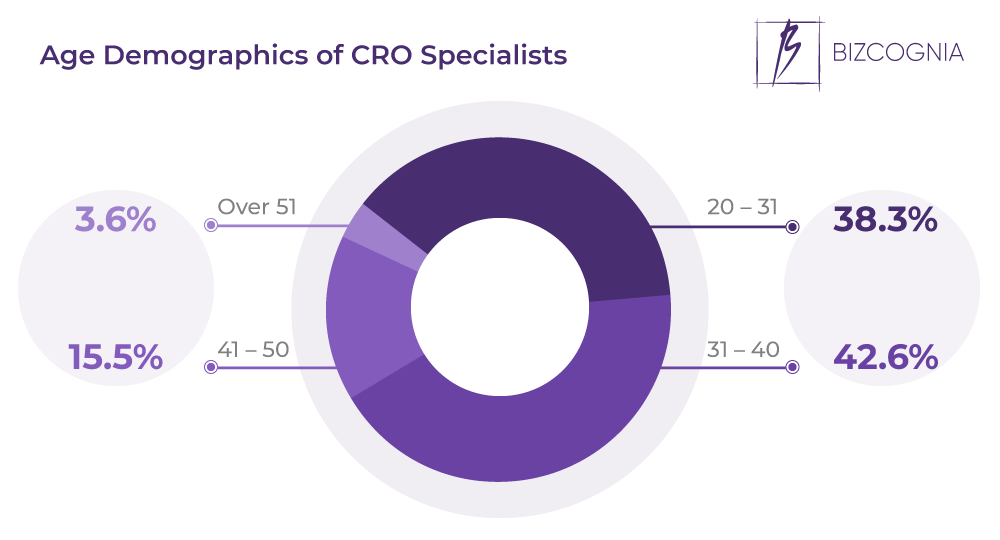
Young people dominate the field of CRO.
The majority of conversion rate optimization specialists are in their early 30s. Over 40% of CRO professionals are in the 31-40 age group, and the second largest group (38.3%) are people between 20 and 30 years old. Only 3.6% fall in the category of people who are 51 or older.
76.3% of CRO professionals are male.
Conversion optimization seems to be a male-dominated industry, with CRO statistics revealing only 23.7% of professionals in the field identify as female.
About 56% of CRO professionals have less than three years of experience.
Conversion rate optimization stats reveal that the majority of professionals in this field have two years of experience, followed by the ones with less than a year. Those with three years of experience rank third, followed by the ones who’ve been in the industry for five years.
Nearly 20% of CRO professionals earn a six-figure annual salary.
However, the vast majority of conversion rate optimization experts (about 25%) earn less than $25,000 a year. This is followed by those earning $50,000-$74,999, which account for a little over 17% of professionals.
CRO in Summation
Hopefully, the compilation of CRO statistics above has helped you familiarize yourself with the latest industry trends, as well as what you can include in your own strategy to make the most out of your online marketing efforts.
Sources: Akamai, Barilliance, Comscore, Deloitte, Digital Information World, Forrester, Future Market Insights, Good Firms, Hubspot, Hubspot, Invesp, Monetate, Social Media Today, Speero, Statista, Unbounce, Upland, Verse, VWO, WebFX, Wordstream, Wordstream, Wordstream, Yotpo